In Pine we can do so, discovering how beneficial that would be. This can be accomplished by quickly switching from one filter to another by input() back and forth, requiring visual memory. A better way could be done by placing two indicators added to the chart and then eventually placed into one indicator pane on top of each other.By adding a filter() helper function that calls other moving average functions chosen for comparison, it can put to the test which moving average is the best drawing filter suited to our expected needs. PhiSmoother was formerly debuted and now it is utilized in a more complex environment in a multitude of ways along side other commonly utilized filters. Now, you the reader, get to judge for yourself...
The following are more well-known classic filters. TEMA (Triple Exponential Moving Average) and DEMA (Double Exponential Moving Average) offer reduced transient response times to price changes fluctuations. WMA (Weighted Moving Average) assigns more weight to recent data points, making it particularly useful for reduced lag. EMA (Exponential Moving Average) strikes a balance between responsiveness and computational efficiency, making it a popular choice. SMA (Simple Moving Average) provides a straightforward calculation based on the arithmetic mean of the data. VWMA and RMA have both been excluded for varying reasons, both being unworthy of having explanation here.
By allowing for adjustment refinements between these filter methods, traders may garner the flexibility to adapt their analysis to different market dynamics, optimizing their algorithms for improved decision-making and performance on demand.
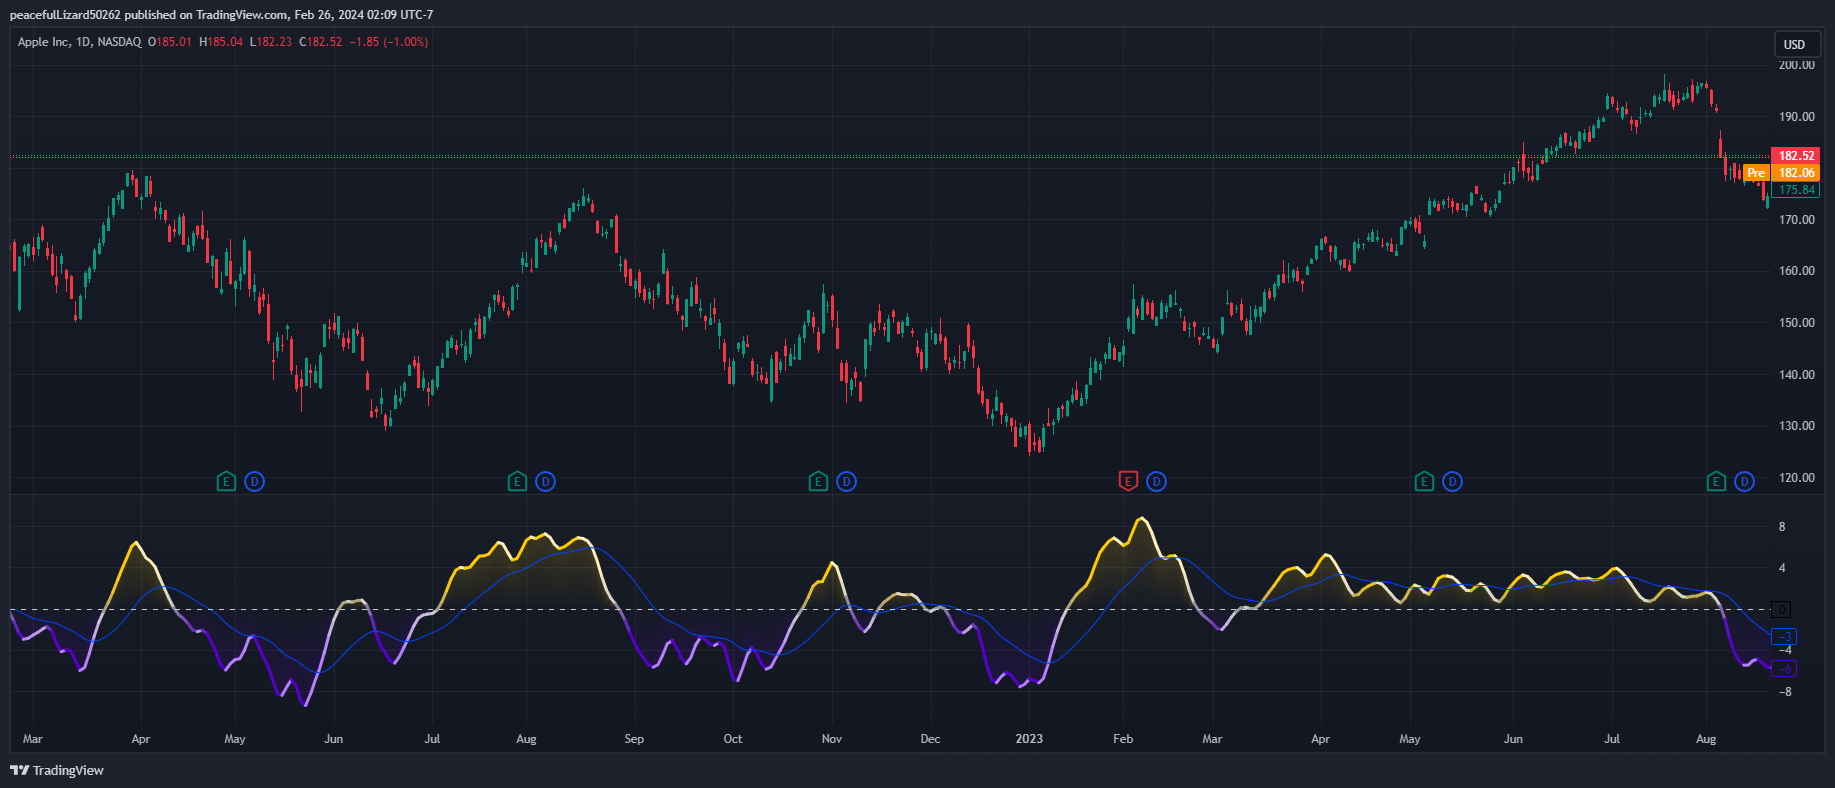
With Volatility mode, the oscillator undergoes a transformation, displaying an unbounded oscillator driven by market volatility. While it still employs the same scoring mechanism, it is now scaled according to the strength of the market move. This can aid with identification of ranging scenarios. However, one side effect is that the oscillator no longer has minimum or maximum boundaries. This can still be advantageous when considering divergences.
// This Source Code Form is subject to the terms of the Attribution-NonCommercial-ShareAlike 4.0 International License - (https://creativecommons.org/licenses/by-nc-sa/4.0/legalcode.txt)
// © ChartPrime
//@version=5
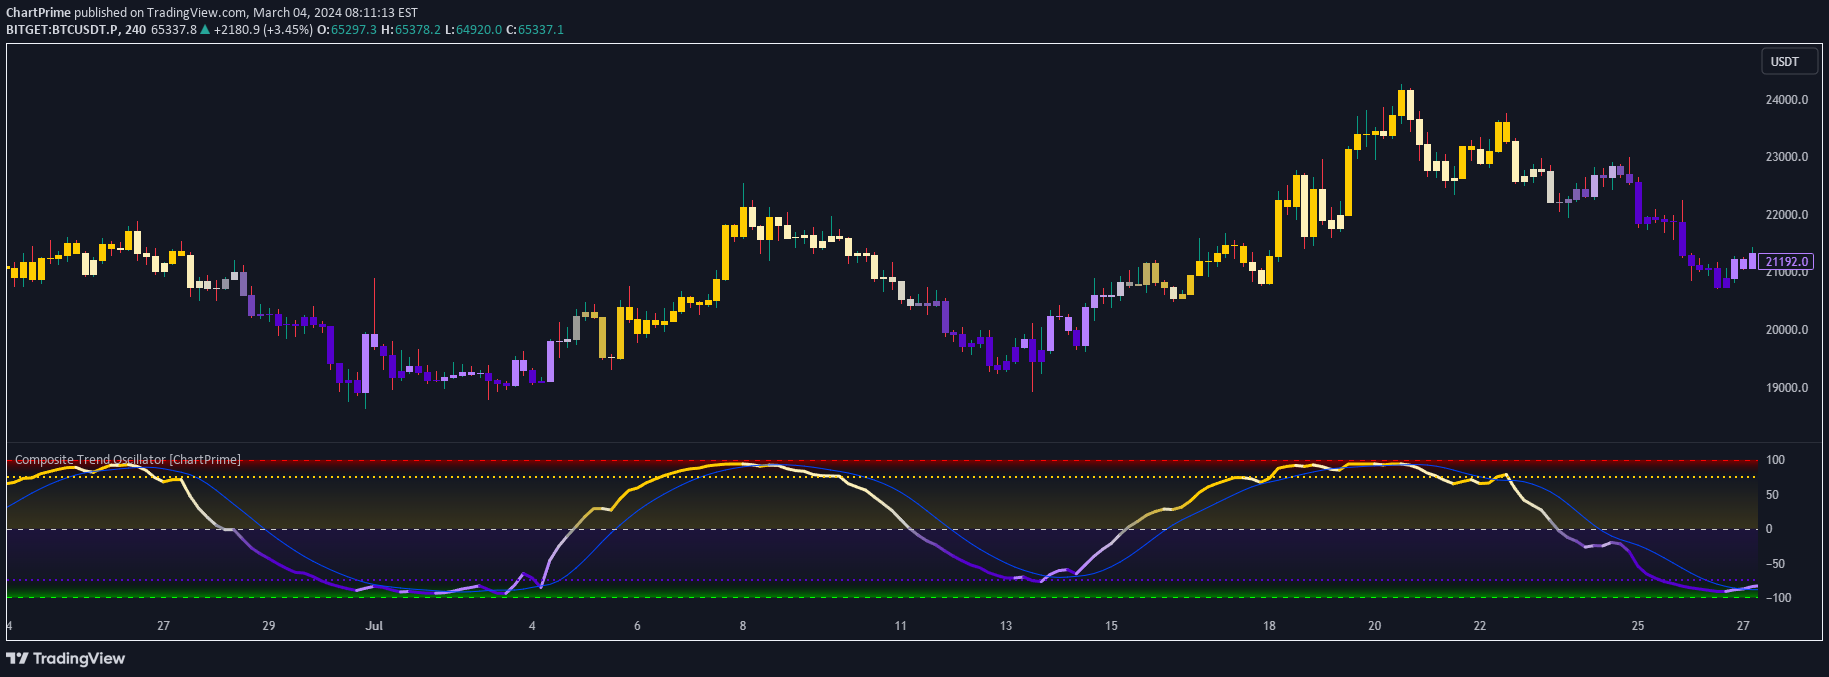
indicator("Composite Trend Oscillator [ChartPrime]", precision=0, timeframe='', timeframe_gaps = true)
PhiSmoother(series float source, simple int length, simple float phase=3.7)=>
var array coefs = na
var int length_1 = length - 1
var float W = 0.0
if na(coefs)
coefs := array.new()
const float SQRT_PIx2 = math.sqrt(2.0 * math.pi)
const float MULTIPLIER = -0.5 / 0.93
var float length_2 = length * 0.52353
for int i=0 to length_1
float alpha = (i + phase - length_2) * MULTIPLIER
float beta = 1.0 / (0.2316419 * math.abs(alpha) + 1.0)
float phi = (math.exp(math.pow(alpha, 2) * -0.5)
*-0.398942280) * beta *
( 0.319381530 + beta *
(-0.356563782 + beta *
( 1.781477937 + beta *
(-1.821255978 + beta
* 1.330274429)))) + 1.011
if alpha < 0.0
phi := 1.0 - phi
float weight = phi / SQRT_PIx2
coefs.push(weight)
W += weight
float sma2 = math.avg(source, nz(source[1], source))
float E = 0.0
for int i=0 to length_1
E += coefs.get(i) * sma2[i]
E / W
ema(series float source, simple float length)=>
float alpha = 2.0 / (length + 1)
var float smoothed = na
smoothed := alpha * source + (1.0 - alpha) * nz(smoothed[1], source)
dema(series float source, simple float length)=>
float ema1 = ema(source, length)
float ema2 = ema( ema1, length)
2.0 * ema1 - ema2
tema(series float source, simple float length)=>
float ema1 = ema(source, length)
float ema2 = ema( ema1, length)
float ema3 = ema( ema2, length)
(ema1 - ema2) * 3.0 + ema3
wma(series float source, simple int length)=>
float weight_sum = length * 0.5 * (length + 1)
float sum = 0.0
for int i=0 to length - 1
sum += source[i] * (length - i)
sum / weight_sum
sma(series float source, simple int length)=>
float sum = ta.cum(source)
if bar_index < length - 1
sum / (bar_index + 1)
else
(sum - sum[length]) / length
filter(series float source,
simple int length,
simple float phase,
simple string style)=>
if length > 1
switch style
"PhiSmoother" => PhiSmoother(source, length, phase)
"EMA" => ema(source, length)
"DEMA" => dema(source, length)
"TEMA" => tema(source, length)
"WMA" => wma(source, length)
=> sma(source, length) // "SMA"
else
source
method get_score(series array source)=>
array scores = array.new()
for int i=0 to source.size() - 1
float current = source.get(i)
int score_sum = 0
for j = 0 to source.size() - 1
float check = source.get(j)
int polarity = i < j ? 1 : -1
if i != j
if current > check
score_sum += polarity
else
score_sum -= polarity
scores.push(score_sum)
scores
method net_score(series array scores)=>
int value = scores.size() - 1
float netScore = ((scores.avg() + value) / (value * 2.0) - 0.5) * 200.0
netScore
method get_color(series float score,
simple float transition_easing,
simple bool volatility_mode,
simple color rising_bullish,
simple color falling_bullish,
simple color falling_bearish,
simple color rising_bearish,
simple color rising_transition,
simple color falling_transition)=>
var color grad = na
float delta = score - nz(score[1], score)
color bullish = delta >= 0.0 ? rising_bullish : falling_bullish
color bearish = delta > 0.0 ? rising_bearish : falling_bearish
color transit = score > 0.0 ? (delta >= 0.0 ? rising_transition : falling_transition)
: (delta >= 0.0 ? falling_transition : rising_transition)
if volatility_mode
float easing = 0.01 * transition_easing
float crms = easing * math.sqrt(ta.cum(math.pow(math.abs(score), 2)) / (bar_index + 1))
grad := if score > 0.0
transition_easing > 0.0 ? color.from_gradient(score, 0.0, crms, transit, bullish) : bullish
else
transition_easing > 0.0 ? color.from_gradient(score, -crms, 0.0, bearish, transit) : bearish
else
grad := if score > 0.0
transition_easing > 0.0 ? color.from_gradient(score, 0.0, transition_easing, transit, bullish) : bullish
else
transition_easing > 0.0 ? color.from_gradient(score, -transition_easing, 0.0, bearish, transit) : bearish
grad
string common = "Common Controls"
float source = input.source( close, "Source", group=common)
string mode = input.string("Trend Strength", "Composite Cluster Mode", group=common, options=["Trend Strength", "Volatility"], tooltip="Trend Strength visualizes the directionality of the filter cluster. Volatility weights the score to the bandwidth of the cluster.")
string filter = input.string( "PhiSmoother", "Cluster Filter", group=common, options=["PhiSmoother", "EMA", "DEMA", "TEMA", "WMA", "SMA"], tooltip="Choose a filter to build the moving average cluster with.")
float phase = input.float ( 3.7, " PhiSmoother Phase", group=common, minval=0.0, step=0.1, tooltip="This allows for subtle adjustment (tweaking) of the phase/lag for PhiSmoother")
string cluster = "Cluster Options"
int spacing = input.int(3, "Cluster Dispersion", group=cluster, minval=1, maxval=10, tooltip="Choose the separation between the moving averages in the cluster.")
int upper_trim = input.int(0, "Cluster Trim - Upper:", group=cluster, inline="trim", minval=0, maxval=31)
int lower_trim = input.int(0, " Lower:", group=cluster, inline="trim", minval=0, maxval=31, tooltip="The 'Upper' parameter modifies the shortest period of the moving averages, whereas 'Lower' parameter adjusts the longest period. Increasing the upper value reduces sensitivity, while increasing the lower value heightens sensitivity.")
string output = "Composite Post Smoothing"
string post_smooth_filt = input.string("PhiSmoother", "PostSmooth - Filter:", group=output, inline="post", options=["PhiSmoother", "EMA", "DEMA", "TEMA", "WMA", "SMA"])
int post_smooth_len = input.int ( 1, " Length:", group=output, inline="post", minval=1, tooltip="Period of the cluster's post smoothing.")
string signal = "Composite Signal Settings"
string signal_filter = input.string("PhiSmoother", "Signal - Filter:", group=signal, inline="signal", options=["PhiSmoother", "EMA", "DEMA", "TEMA", "WMA", "SMA"])
int signal_length = input.int ( 20, " Length:", group=signal, inline="signal", minval=1, tooltip="Period of the momentum signal plot.")
color signal_color = input.color ( #0044FF, "Filter Color", group=signal)
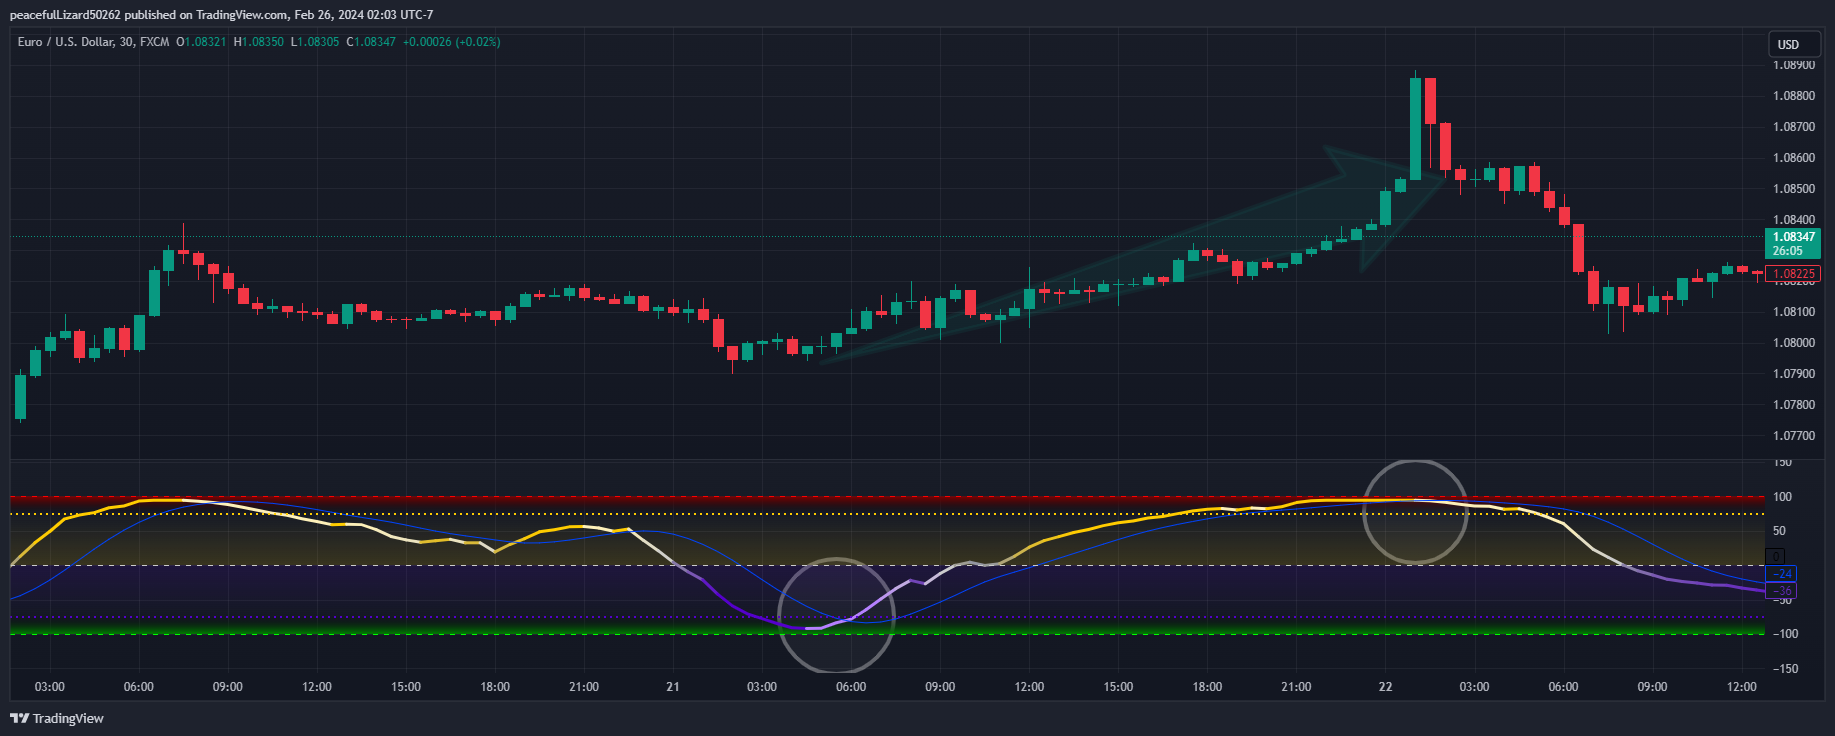
string threshold = "Threshold Levels"
float upperLevel = input.float( 75.00, "Levels - Upper:", group=threshold, inline="level", minval= 1.0, maxval=99.0, step=2.0)
float lowerLevel = input.float(-75.00, " Lower:", group=threshold, inline="level", minval=-99.0, maxval=-1.0, step=2.0, tooltip="Fine-tune the thresholds to your liking")
string colors = "Coloring Preferences"
bool candle_color = input.bool ( false, "Candle Coloring", group=colors)
float transition_easing = input.float( 50.0, "Transition Easing", group=colors, maxval= 100.0, minval=0.0, step=5.0, tooltip="Adjust the sensitivity to ranging conditions.")
bool fill_bg = input.bool ( true, "Fill Background ", group=colors, inline= "fill")
int fill_alpha = input.int ( 85, "", group=colors, inline= "fill", minval=0, maxval=100)
color rising_bullish = input.color(#FFCC00, "Bullish Color ", group=colors, inline= "bull")
color falling_bullish = input.color(#FDf0B9, "", group=colors, inline= "bull")
color rising_transition = input.color(#9598A1, "Transition Color", group=colors, inline="range")
color falling_transition = input.color(#CCCCCC, "", group=colors, inline="range")
color falling_bearish = input.color(#5500CC, "Bearish Color ", group=colors, inline= "bear")
color rising_bearish = input.color(#B580FF, "", group=colors, inline= "bear")
var bool VOLATILITY_MODE_ON = mode == "Volatility"
array filter_cluster = array.new(34)
filter_cluster.set( 0, source)
filter_cluster.set( 1, filter(source, spacing, phase, filter))
filter_cluster.set( 2, filter(source, 2 * spacing, phase, filter))
filter_cluster.set( 3, filter(source, 3 * spacing, phase, filter))
filter_cluster.set( 4, filter(source, 4 * spacing, phase, filter))
filter_cluster.set( 6, filter(source, 5 * spacing, phase, filter))
filter_cluster.set( 7, filter(source, 6 * spacing, phase, filter))
filter_cluster.set( 8, filter(source, 7 * spacing, phase, filter))
filter_cluster.set( 9, filter(source, 8 * spacing, phase, filter))
filter_cluster.set(10, filter(source, 9 * spacing, phase, filter))
filter_cluster.set(11, filter(source, 10 * spacing, phase, filter))
filter_cluster.set(12, filter(source, 11 * spacing, phase, filter))
filter_cluster.set(13, filter(source, 12 * spacing, phase, filter))
filter_cluster.set(14, filter(source, 13 * spacing, phase, filter))
filter_cluster.set(15, filter(source, 14 * spacing, phase, filter))
filter_cluster.set(16, filter(source, 15 * spacing, phase, filter))
filter_cluster.set(17, filter(source, 16 * spacing, phase, filter))
filter_cluster.set(18, filter(source, 17 * spacing, phase, filter))
filter_cluster.set(19, filter(source, 18 * spacing, phase, filter))
filter_cluster.set(20, filter(source, 19 * spacing, phase, filter))
filter_cluster.set(21, filter(source, 20 * spacing, phase, filter))
filter_cluster.set(22, filter(source, 21 * spacing, phase, filter))
filter_cluster.set(23, filter(source, 22 * spacing, phase, filter))
filter_cluster.set(24, filter(source, 23 * spacing, phase, filter))
filter_cluster.set(25, filter(source, 24 * spacing, phase, filter))
filter_cluster.set(26, filter(source, 25 * spacing, phase, filter))
filter_cluster.set(27, filter(source, 26 * spacing, phase, filter))
filter_cluster.set(28, filter(source, 27 * spacing, phase, filter))
filter_cluster.set(29, filter(source, 28 * spacing, phase, filter))
filter_cluster.set(30, filter(source, 29 * spacing, phase, filter))
filter_cluster.set(31, filter(source, 30 * spacing, phase, filter))
filter_cluster.set(32, filter(source, 31 * spacing, phase, filter))
filter_cluster.set(33, filter(source, 32 * spacing, phase, filter))
if upper_trim > 0
for int i=0 to math.min(upper_trim - 1, filter_cluster.size() - 1)
if filter_cluster.size() > 2
filter_cluster.shift()
else
break
if lower_trim > 0
for int i=0 to math.min(lower_trim - 1, filter_cluster.size() - 1)
if filter_cluster.size() > 2
filter_cluster.pop()
else
break
float ribbon_max = filter_cluster.max()
float ribbon_min = filter_cluster.min()
float ribbon_width = ribbon_max - ribbon_min
float ribbon_rank = VOLATILITY_MODE_ON ? nz(ribbon_width / math.avg(ribbon_max, ribbon_min)) : 1
array score = filter_cluster.get_score()
float net_score = filter(score.net_score() * ribbon_rank, post_smooth_len, 3.7, post_smooth_filt)
color main_color = net_score.get_color(transition_easing, VOLATILITY_MODE_ON, rising_bullish, falling_bullish, falling_bearish, rising_bearish, rising_transition, falling_transition)
float signal_value = signal_length < 2 ? na : filter(ta.sma(net_score, 2), signal_length, 3.7, signal_filter)
top = hline(VOLATILITY_MODE_ON ? na : 100.0, "Top", #FF0000)
upper = hline(VOLATILITY_MODE_ON ? na : upperLevel, "+Level", rising_bullish, hline.style_dotted, 2)
center = hline( 0.0, "Center", #CCCCCC)
lower = hline(VOLATILITY_MODE_ON ? na : lowerLevel, "+Level", falling_bearish, hline.style_dotted, 2)
bottom = hline(VOLATILITY_MODE_ON ? na : -100.0, "Bottom", #00FF00)
const color invisible = #00000000
fill( top, upper, 100.0, upperLevel, #800000, invisible)
fill(center, upper, upperLevel, 0.0, color.new( rising_bullish, 100), color.new(rising_bullish, fill_bg ? fill_alpha : 100))
fill(center, lower, 0.0, lowerLevel, color.new(falling_bearish, fill_bg ? fill_alpha : 100), color.new(falling_bearish, 100))
fill(bottom, lower, lowerLevel, -100.0, invisible, #008000)
barcolor(candle_color ? main_color : na)
net = plot(net_score, "Score", main_color, 3)
zero = plot( 0.0, "", invisible)
plot(signal_value, "Signal", signal_color, 1)
fill(net, zero, net_score > 0.0 ? net_score : 0.0,
net_score > 0.0 ? 0.0 : net_score,
net_score > 0.0 ? color.new(rising_bullish, fill_bg and VOLATILITY_MODE_ON ? fill_alpha : 100) : color.new(falling_bearish, 100),
net_score > 0.0 ? color.new(rising_bullish, 100) : color.new(falling_bearish, fill_bg and VOLATILITY_MODE_ON ? fill_alpha : 100))