Description: Determines the period over which the linear regression is calculated. A longer period smooths the oscillator but may lag, while a shorter period is more responsive but may be noisier.
Description: Option to color the price bars based on the oscillator's value, providing a visual representation of market conditions. Bars turn cyan for positive oscillator values and blue for negative.
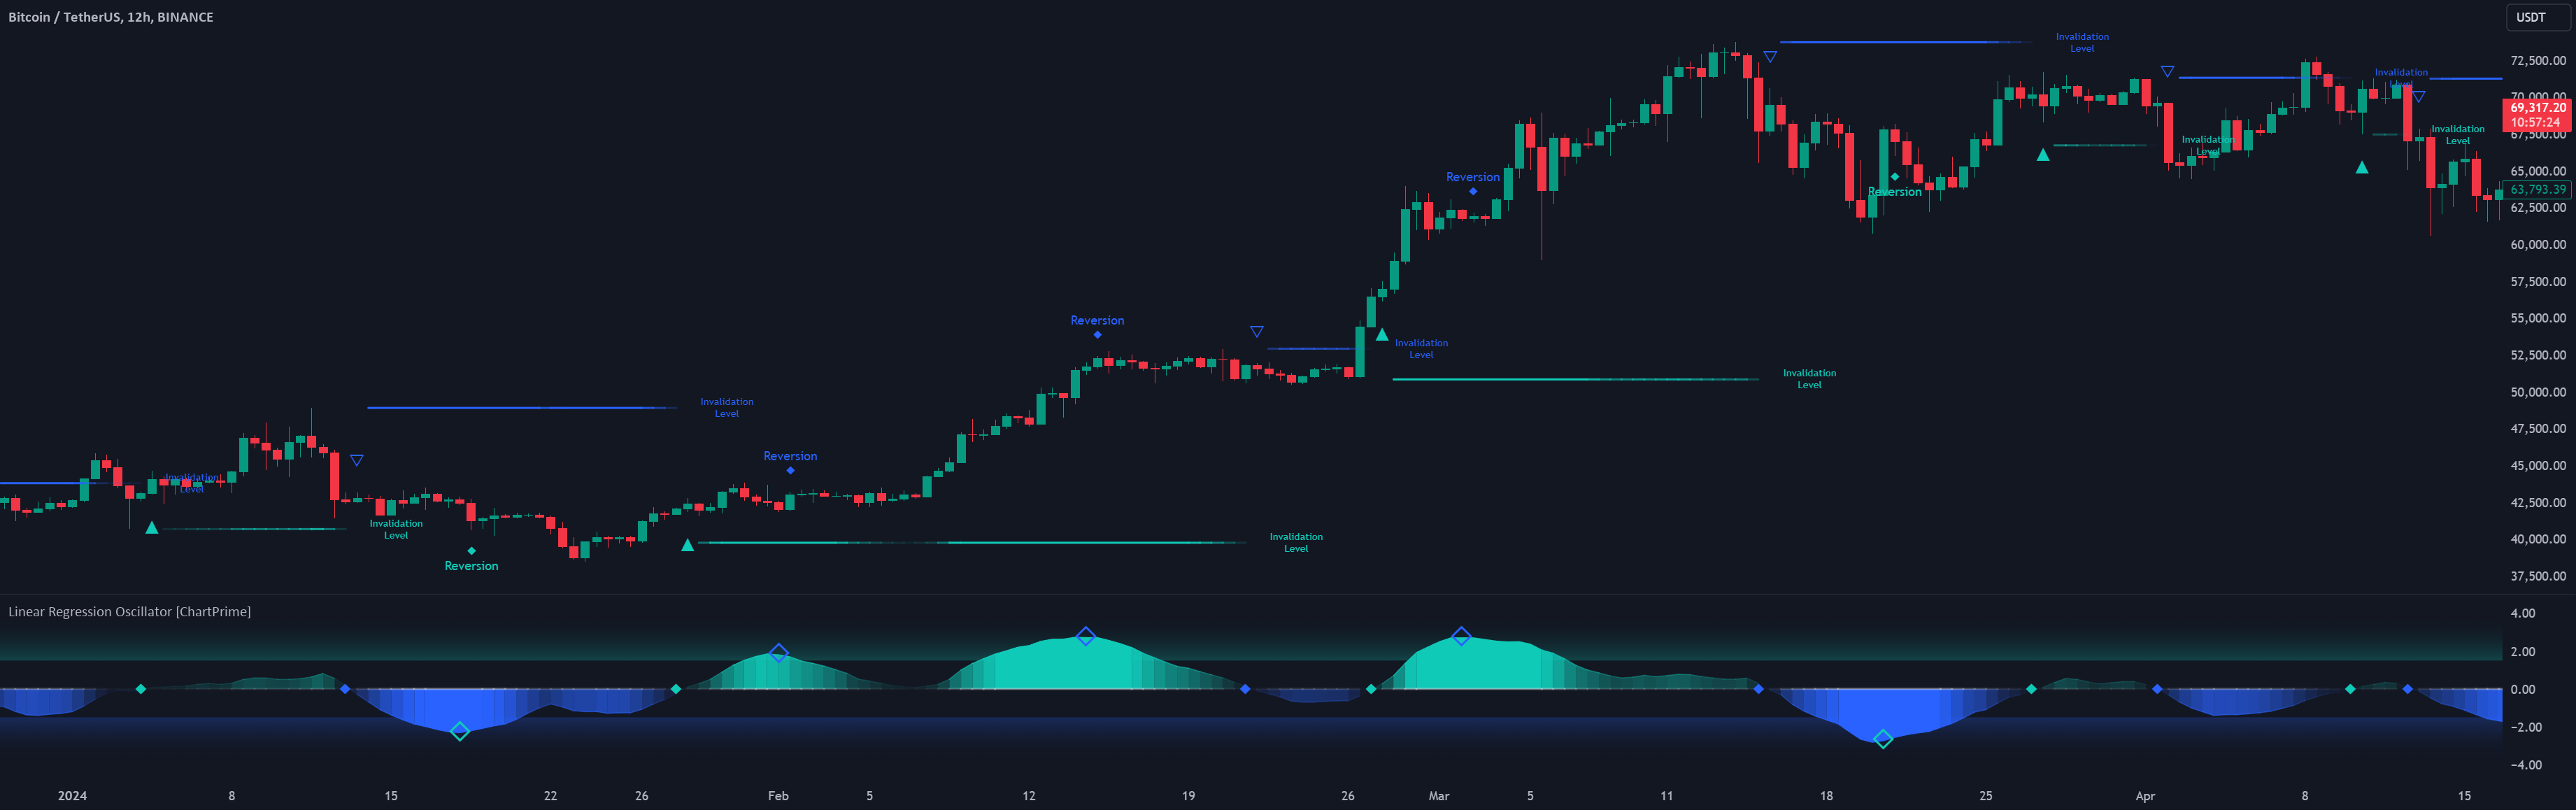
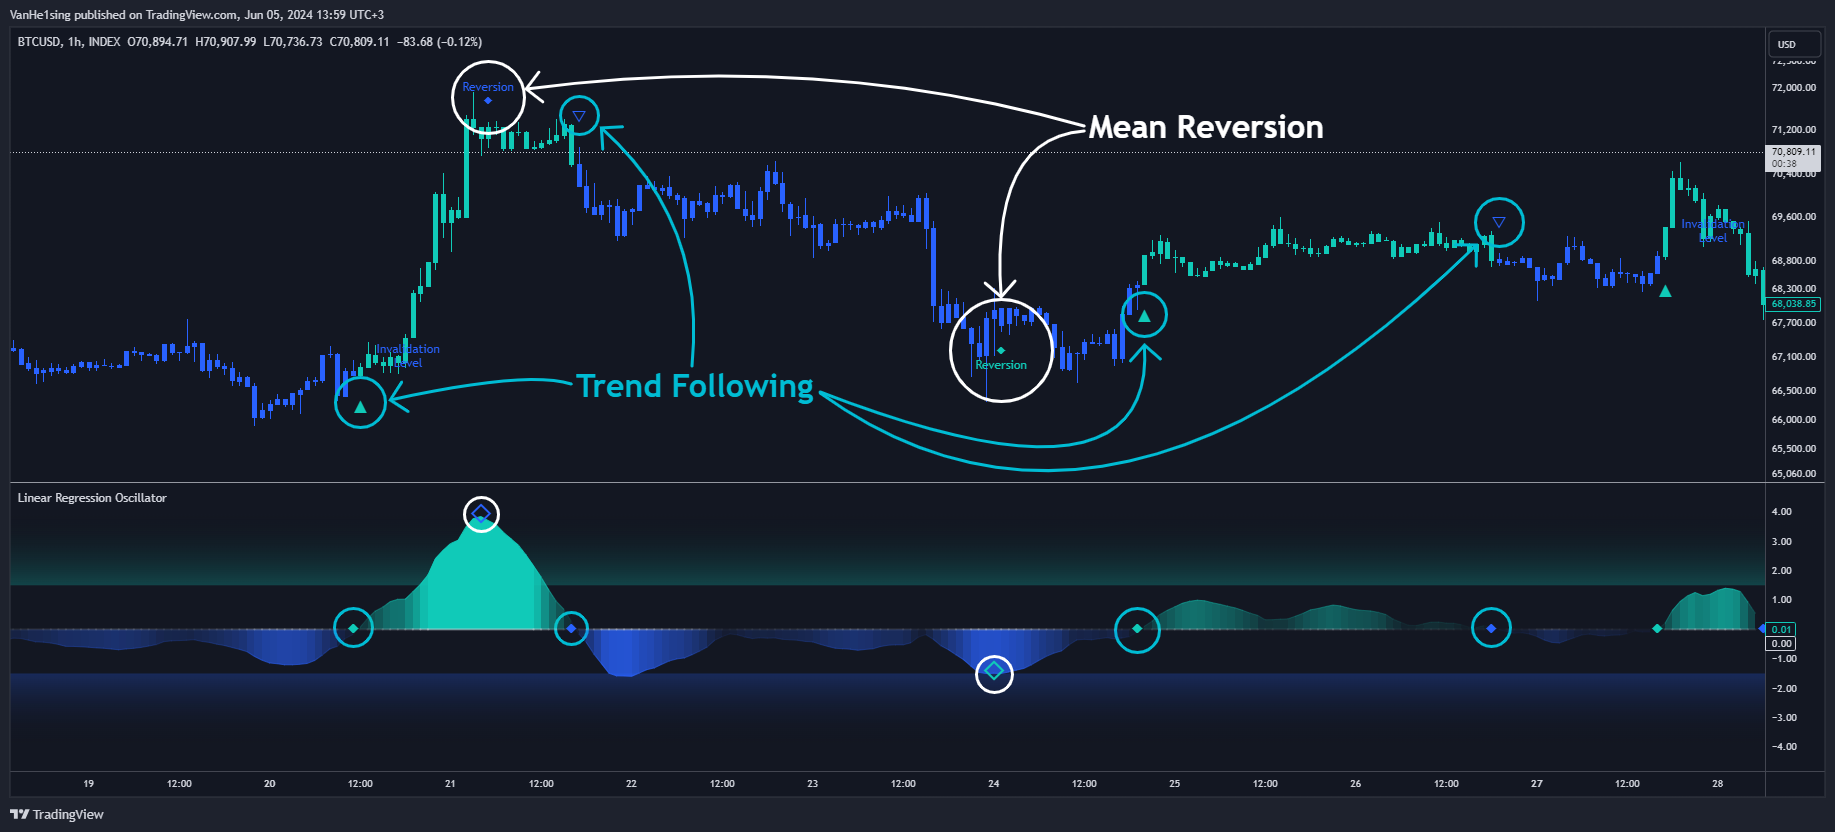
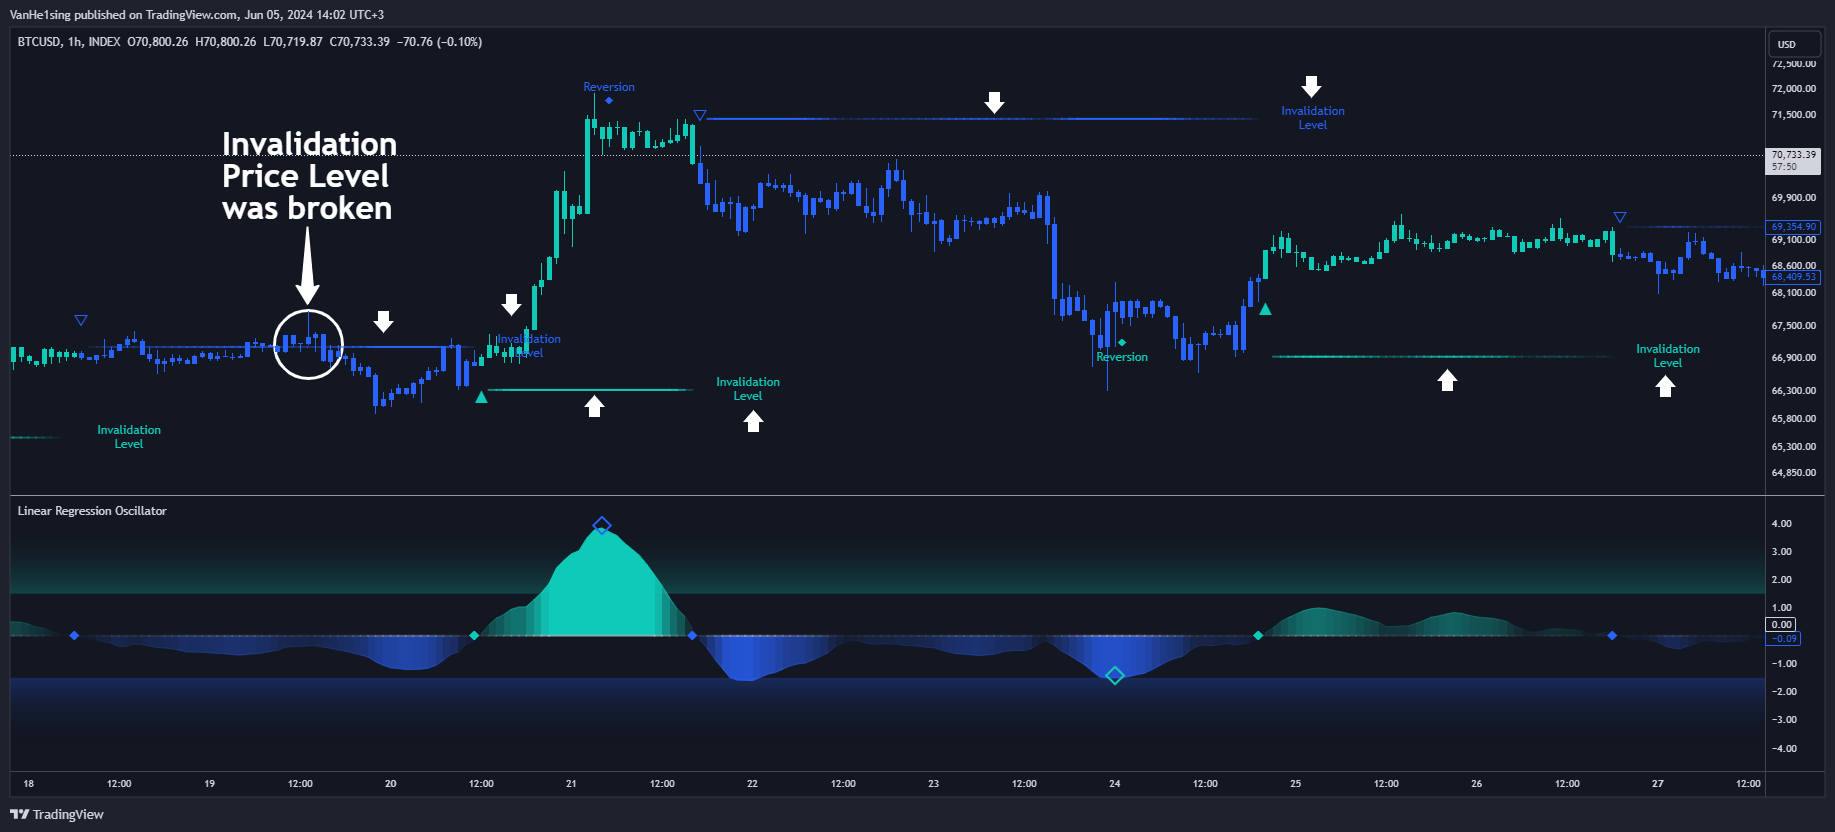
This indicator helps traders identify overbought and oversold conditions, potential mean reversions, and trend changes based on the linear regression of the closing prices over a specified look-back period.
// This Pine Script™ code is subject to the terms of the Mozilla Public License 2.0 at https://mozilla.org/MPL/2.0/
// © ChartPrime

//@version=5
indicator("Linear Regression Oscillator [ChartPrime]", overlay=false, max_labels_count = 500)


// ---------------------------------------------------------------------------------------------------------------------}
// 𝙐𝙎𝙀𝙍 𝙄𝙉𝙋𝙐𝙏𝙎
// ---------------------------------------------------------------------------------------------------------------------{
int length   = input.int(20, "Length")
float upper  = input.float(1.5,  "Upper Threshold", step = 0.1)
float lower  = input.float(-1.5, "Lower Threshold", step = 0.1)

bool candles = input.bool(false, "Plot Bar Color")

color col_up = #10cab8
color col_dn = color.blue

// Source
series float source = close[barstate.isconfirmed ? 0 : 1]

// Max and Min prices for Invalidation Levels (period 5 bars back)
var lowest              = array.new(5)
var highest             = array.new(5)
var series float points = na


// ---------------------------------------------------------------------------------------------------------------------}
// 𝙄𝙉𝘿𝙄𝘾𝘼𝙏𝙊𝙍 𝘾𝘼𝙇𝘾𝙐𝙇𝘼𝙏𝙄𝙊𝙉𝙎
// ---------------------------------------------------------------------------------------------------------------------{
//@function Calculation of slope and intercept
//@param length LookBack Period
//@returns  Linear Regression Oscillator
linear_regression_osc(int length)=>
    n      = length
    sum_x  = 0.0
    sum_y  = 0.0
    sum_xy = 0.0
    sum_x_squared = 0.0

    for i = 0 to n - 1
        sum_x         := sum_x + i
        sum_y         := sum_y + source[i]
        sum_xy        := sum_xy + i * source[i]
        sum_x_squared := sum_x_squared + i * i

        m = (n * sum_xy - sum_x * sum_y) / (n * sum_x_squared - sum_x * sum_x)
        c = (sum_y - m * sum_x) / n

        linear_regression = ((m * bar_index + c)*-1)

// Calculate linear regression Oscillator
linear_regression = linear_regression_osc(length)

// Normaliztion
linear_regression := (linear_regression - ta.sma(linear_regression, 100)) / ta.stdev(linear_regression, 100)

// Conditions of Mean Reversion and Trends
cond1  = ta.crossunder(linear_regression, 0)
cond2  = ta.crossover( linear_regression, 0)

cond_1 = ta.crossunder(linear_regression, linear_regression[2])
          and
         linear_regression > upper ? linear_regression[1] : na

cond_2 = ta.crossover(linear_regression, linear_regression[2])
          and
         linear_regression < lower ? linear_regression[1] : na

// Invalidation Price Levels
lowest. push(low)
highest.push(high)

switch
    lowest.size() > 5 => lowest.shift(), highest.shift()

switch
    cond1 => points := highest.max()
    cond2 => points := lowest. min()


// ---------------------------------------------------------------------------------------------------------------------}
// 𝙑𝙄𝙎𝙐𝘼𝙇𝙄𝙕𝘼𝙏𝙄𝙊𝙉
// ---------------------------------------------------------------------------------------------------------------------{
// Defined Colors
color = linear_regression > 0
         ? color.from_gradient(linear_regression, 0, 2, color(na), col_up)
         : color.from_gradient(linear_regression, -2, 0, col_dn, color(na))
color1= linear_regression > 0
         ? color.from_gradient(linear_regression, 0, 2, color(na), color.new(chart.fg_color, 50))
         : color.from_gradient(linear_regression, -2, 0, color.new(chart.fg_color, 50), color(na))
color2= linear_regression > 0
         ? color.from_gradient(linear_regression, 0, 1, color(na), col_up)
         : color.from_gradient(linear_regression, -1, 0, col_dn, color(na))

// Plot Oscillator
plot(linear_regression, color = color, style = plot.style_area)

// Zero Line
plot(0, color = color1, linewidth = 2)

// Upper and Lower Thresholds
p1 = plot(upper, display = display.none)
p3 = plot(lower, display = display.none)
p4 = plot(-4,    display = display.none)
p2 = plot(4,     display = display.none)

fill(p1, p2, 4, upper, na, color.new(col_up, 75))
fill(p3, p4, lower, -4, color.new(col_dn, 75), na)

if barstate.islast
    l1 = label.new(bar_index, upper, str.tostring(upper),
               style = label.style_diamond, size = size.tiny, textcolor = chart.fg_color, color = col_up)
    label.delete(l1[1])
    l2 = label.new(bar_index, lower, str.tostring(lower),
               style = label.style_diamond, size = size.tiny, textcolor = chart.fg_color, color = col_dn)
    label.delete(l2[1])
// Oscillator Mean Reversion above or below Thresholds
plotchar(cond_1, "", "◇",
         color = col_dn,
         location = location.absolute,
         size = size.small,
         offset = -1
         )
plotchar(cond_2, "", "◇",
         color = col_up,
         location = location.absolute,
         size = size.small,
         offset = -1
         )
// Oscillator Crosses zero Line
plotchar(cond1 ? 0 : na, "", "◆",
         color = color.new(col_dn, 0),
         location = location.absolute,
         size = size.tiny,
         offset = -1
         )
plotchar(cond2 ? 0 : na, "", "◆",
         color = color.new(col_up, 0),
         location = location.absolute,
         size = size.tiny,
         offset = -1
         )

// Trend Labels on the chart
switch
    cond2 => label.new(chart.point.from_index(bar_index, low), "▲",
                       style         = label.style_label_up,
                       textcolor     = col_up,
                       size          = size.large,
                       color         = color(na),
                       force_overlay = true
                       )
    cond1 => label.new(chart.point.from_index(bar_index, high), "▽",
                       style         = label.style_label_down,
                       textcolor     = col_dn,
                       size          = size.large,
                       color         = color(na),
                       force_overlay = true
                       )
// Meant Reversion Labels on the chart
switch
    cond_2 => label.new(chart.point.from_index(bar_index, low),
                       text          = "◆\nReversion",
                       style         = label.style_label_up,
                       textcolor     = col_up,
                       size          = size.normal,
                       color         = color(na),
                       force_overlay = true
                       )
    cond_1 => label.new(chart.point.from_index(bar_index, high),
                       text          = "Reversion\n◆",
                       style         = label.style_label_down,
                       textcolor     = col_dn,
                       size          = size.normal,
                       color         = color(na),
                       force_overlay = true
                       )

// Invalidation Price Levels
plot(not ta.change(points) ? points : na,
         color          = color2,
         linewidth      = 2,
         style          = plot.style_linebr,
         force_overlay  = true
         )

if ta.change(points)
    label.new(chart.point.from_index(bar_index, points[1]),
                       text          = "Invalidation\nLevel",
                       style         = label.style_label_left,
                       textcolor     = linear_regression < 0 ? col_up : col_dn,
                       size          = size.small,
                       color         = color(na),
                       force_overlay = true
                       )

// Candles Color
candle_col = candles ? (linear_regression < 0 ? col_dn : col_up) : na
plotcandle(open, high, low, close,
             title = "Color Candles",
             color = candle_col,
             bordercolor = candle_col,
             wickcolor = candle_col,
             force_overlay= true
             )
barcolor(candle_col)

//◆ ♢ ❖ ◇ ⬖
// ---------------------------------------------------------------------------------------------------------------------}