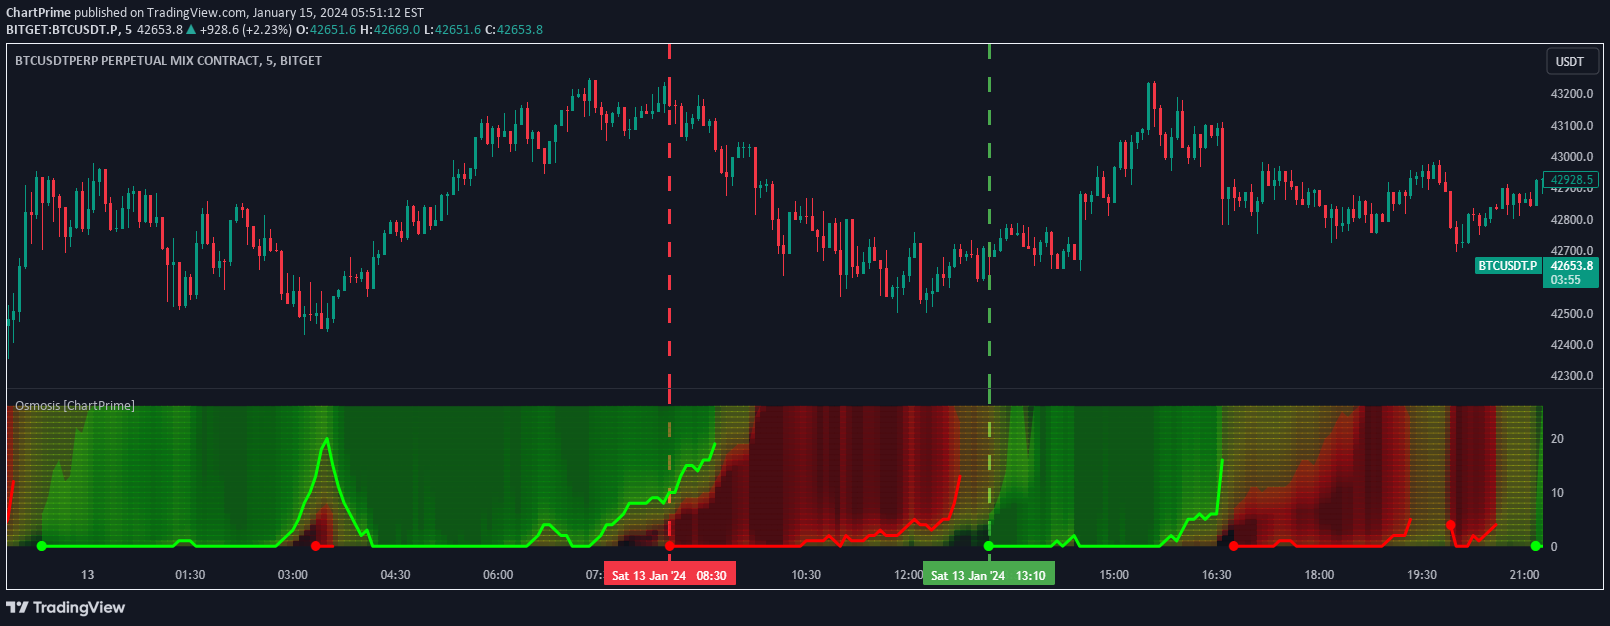
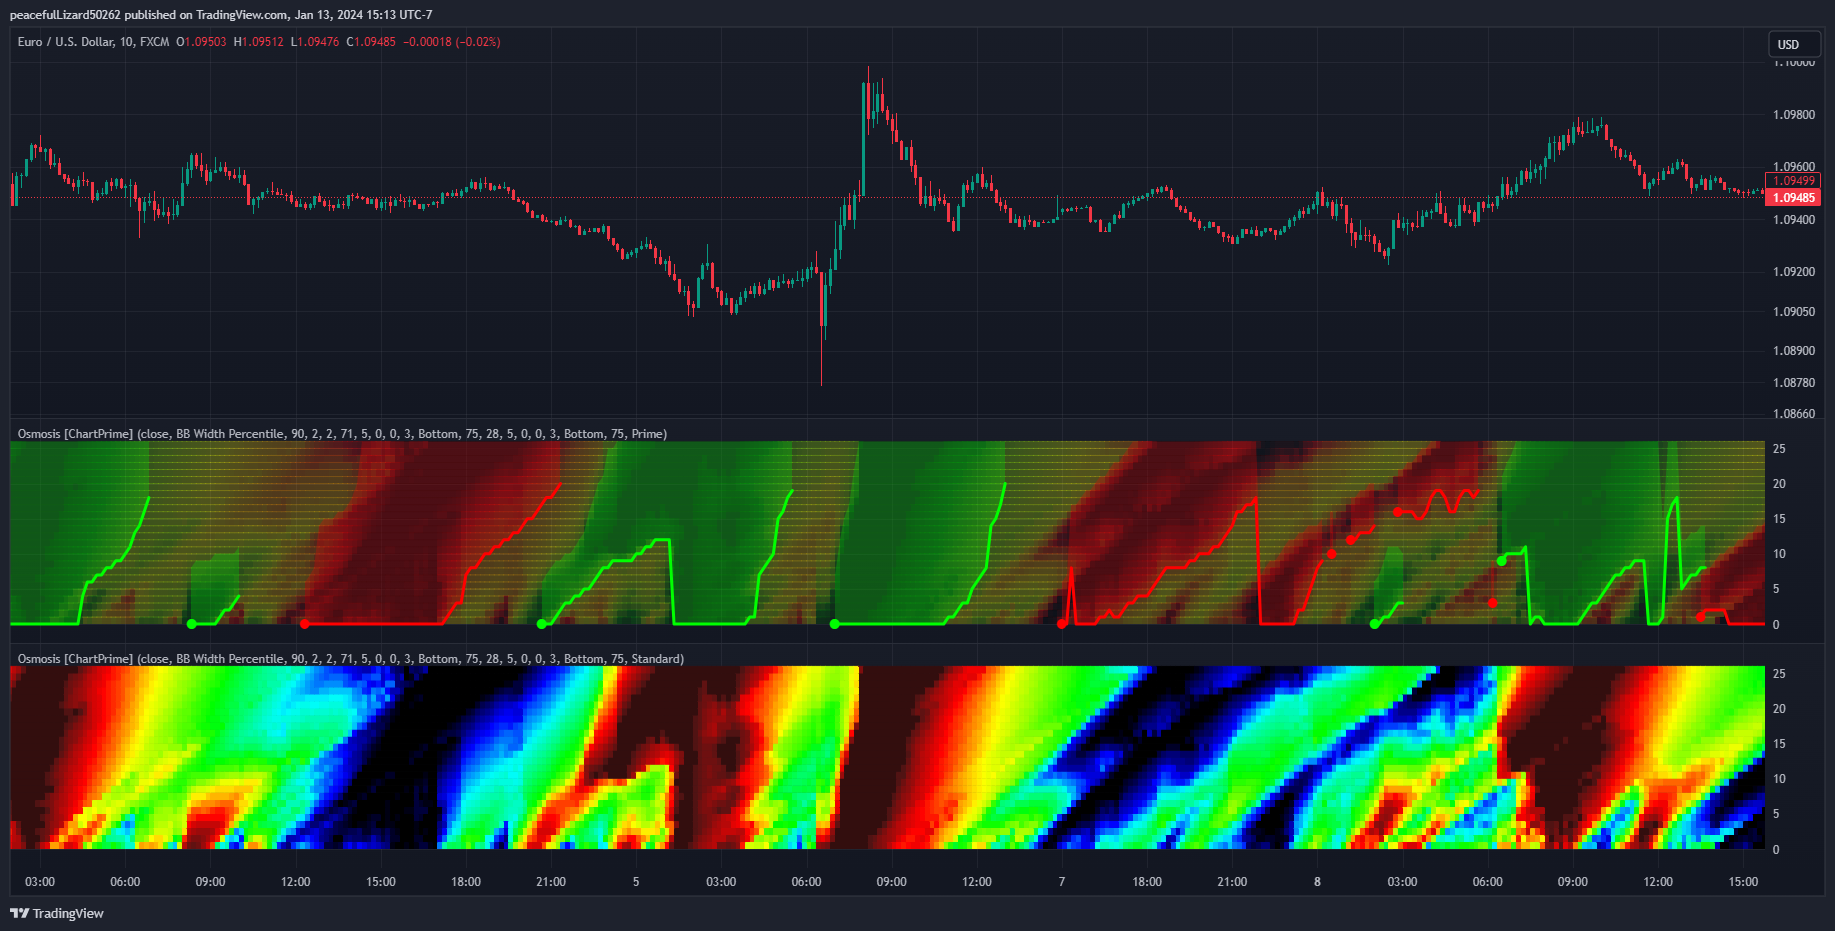
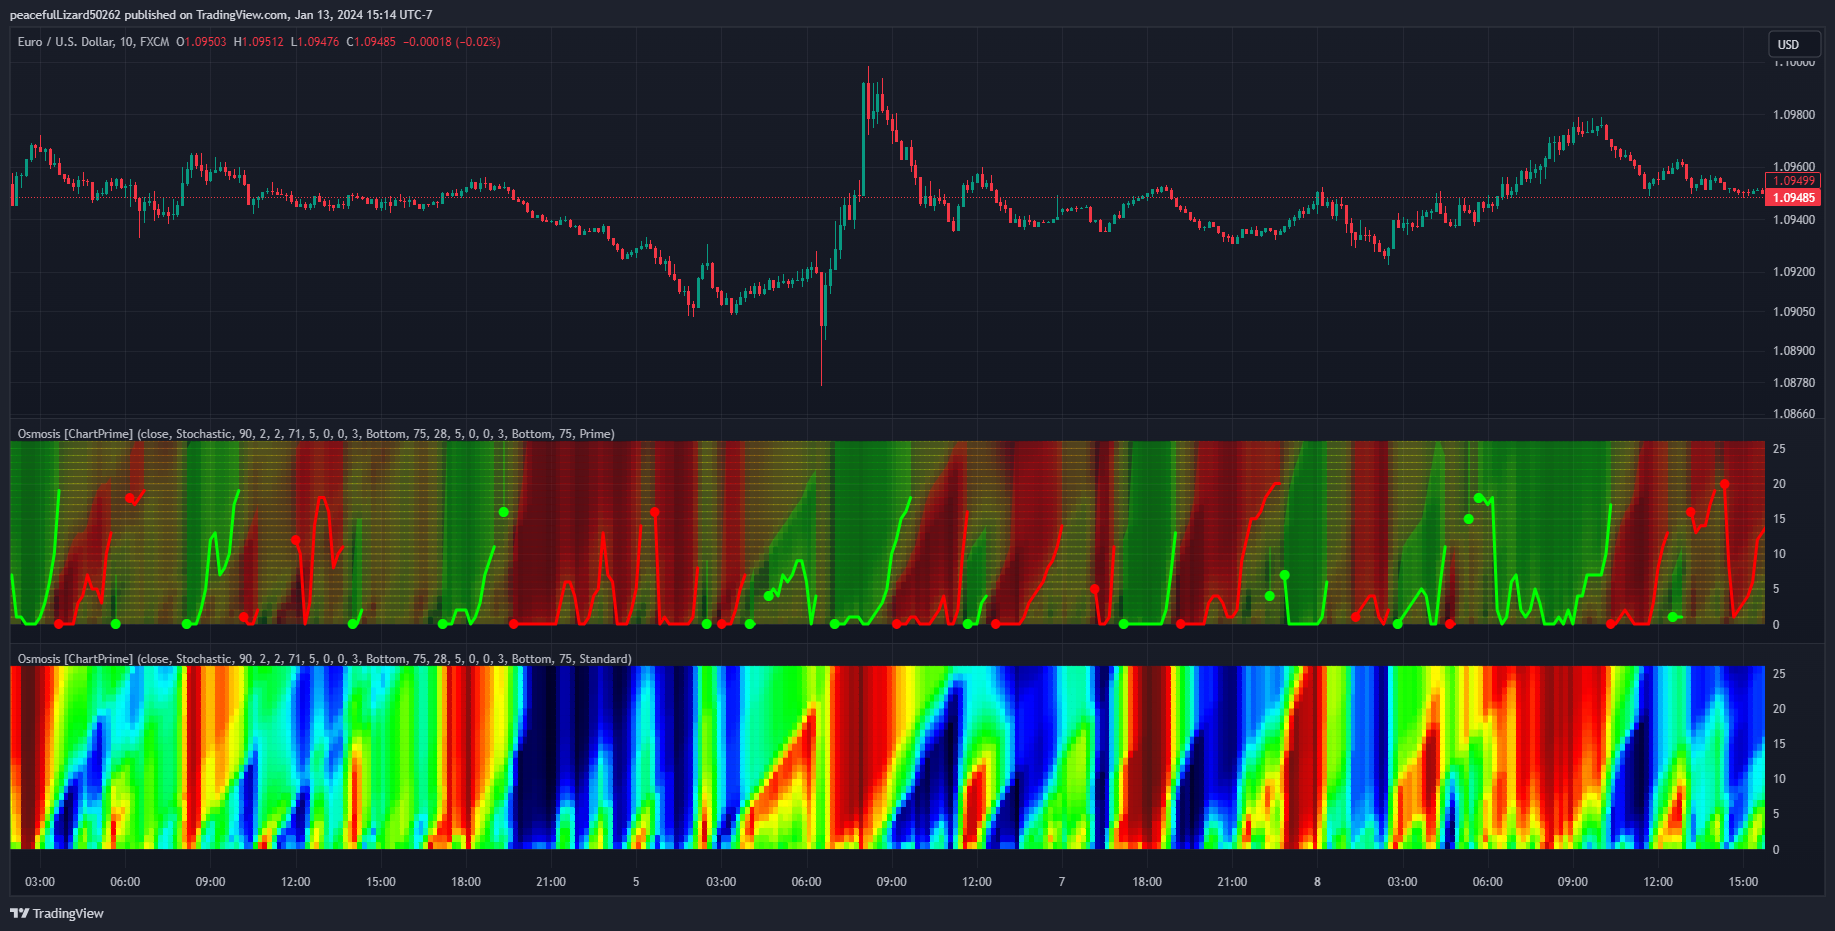
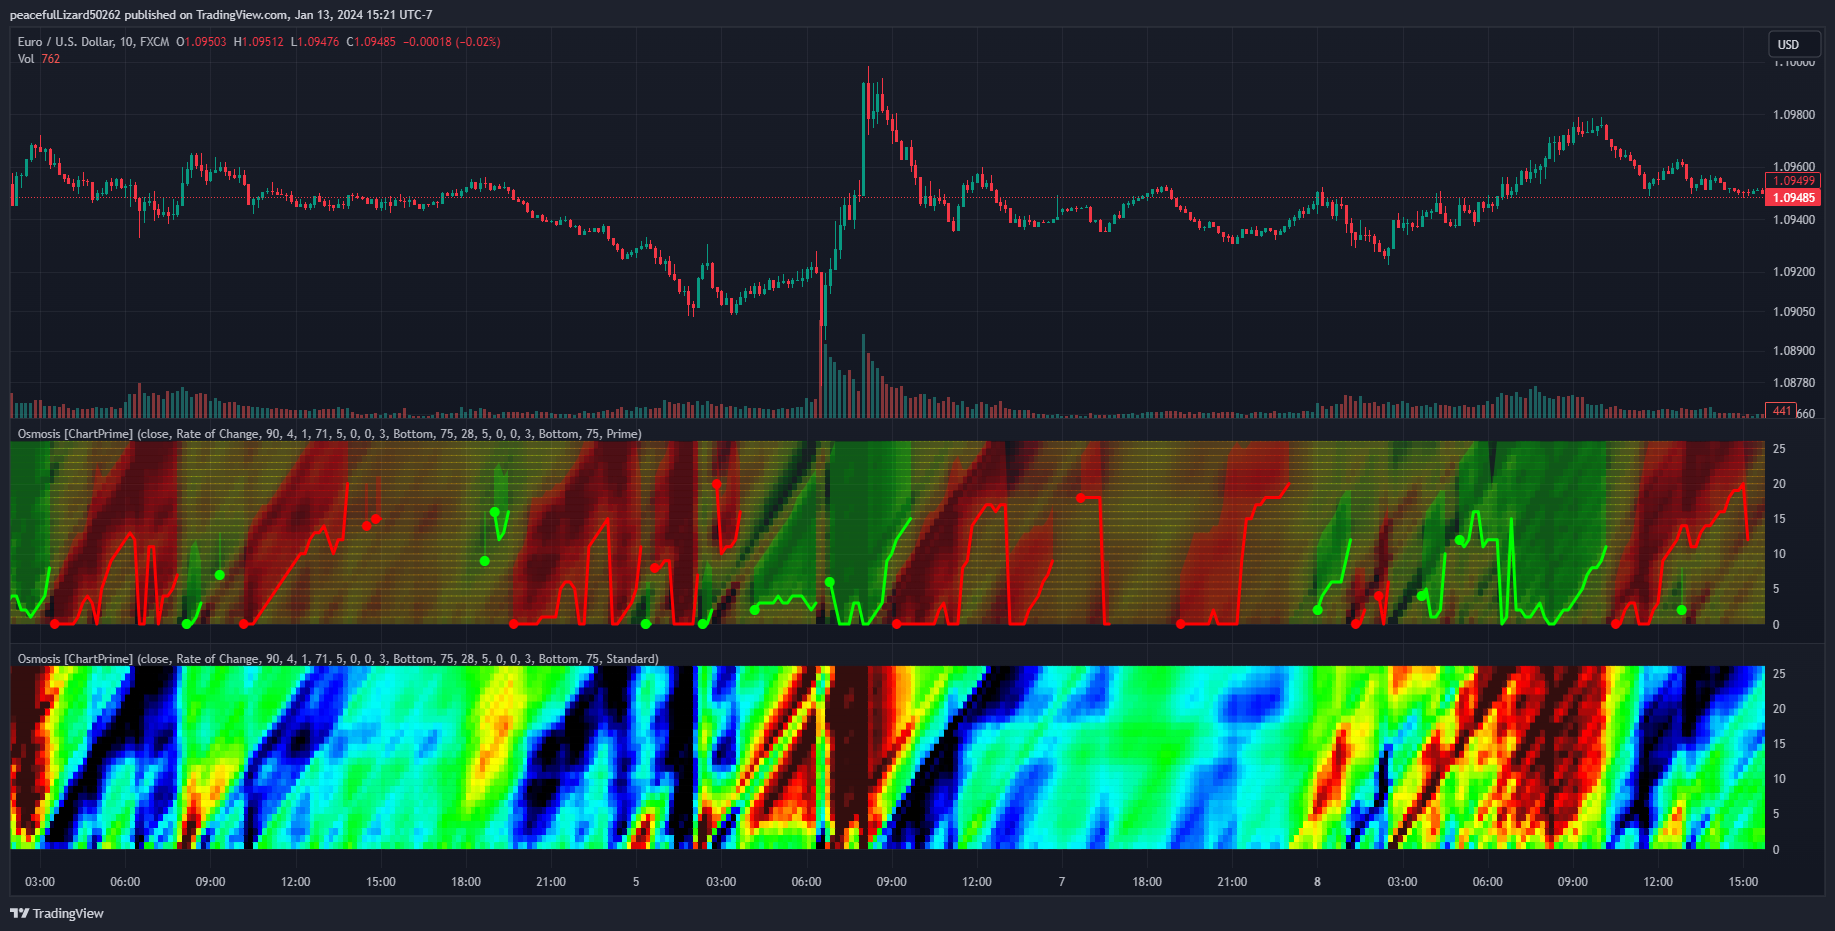
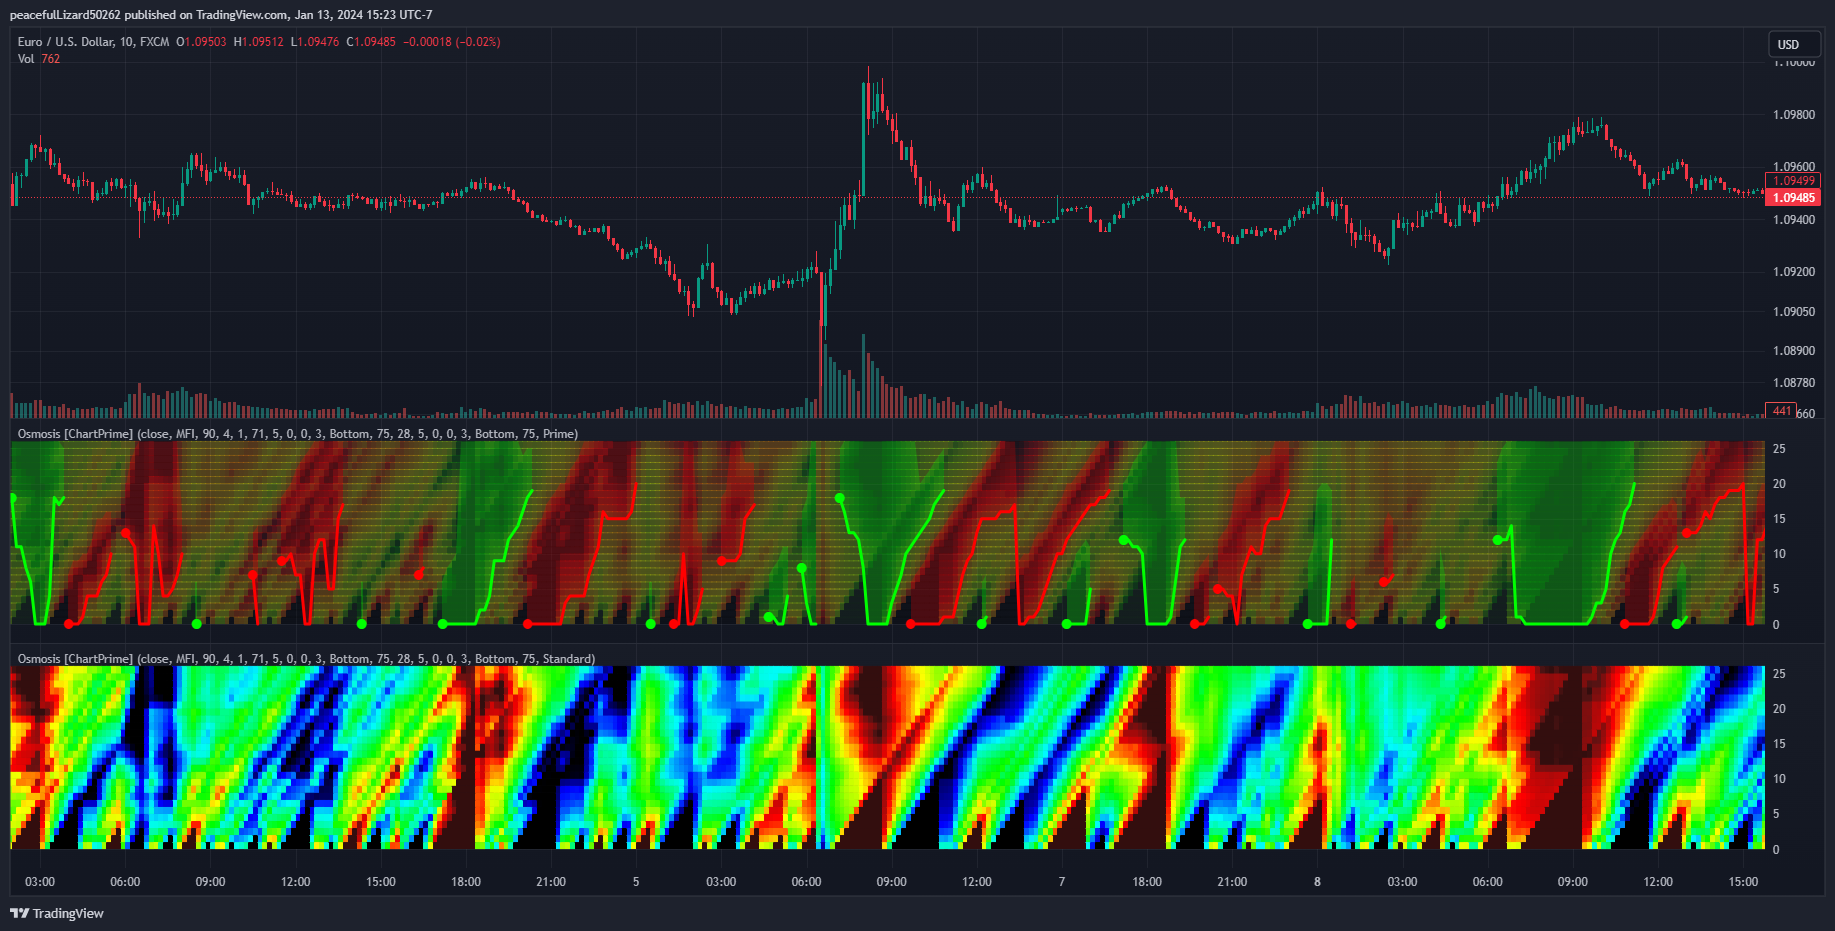
One major feature of this indicator is its ability to signal potential trend reversals. For example, a shift in the direction at the lower end of the heatmap can indicate a weakening of the current trend, suggesting a possible reversal. On the other hand, when the heatmap is fully saturated at all levels, it may indicate a strong trend that could be nearing a reversal point.
Another important and unique aspect of the Osmosis indicator is its automatic highlighting feature. This feature emphasizes regions within the heatmap that score exceptionally high or low, drawing attention to significant market movements or potential anomalies.
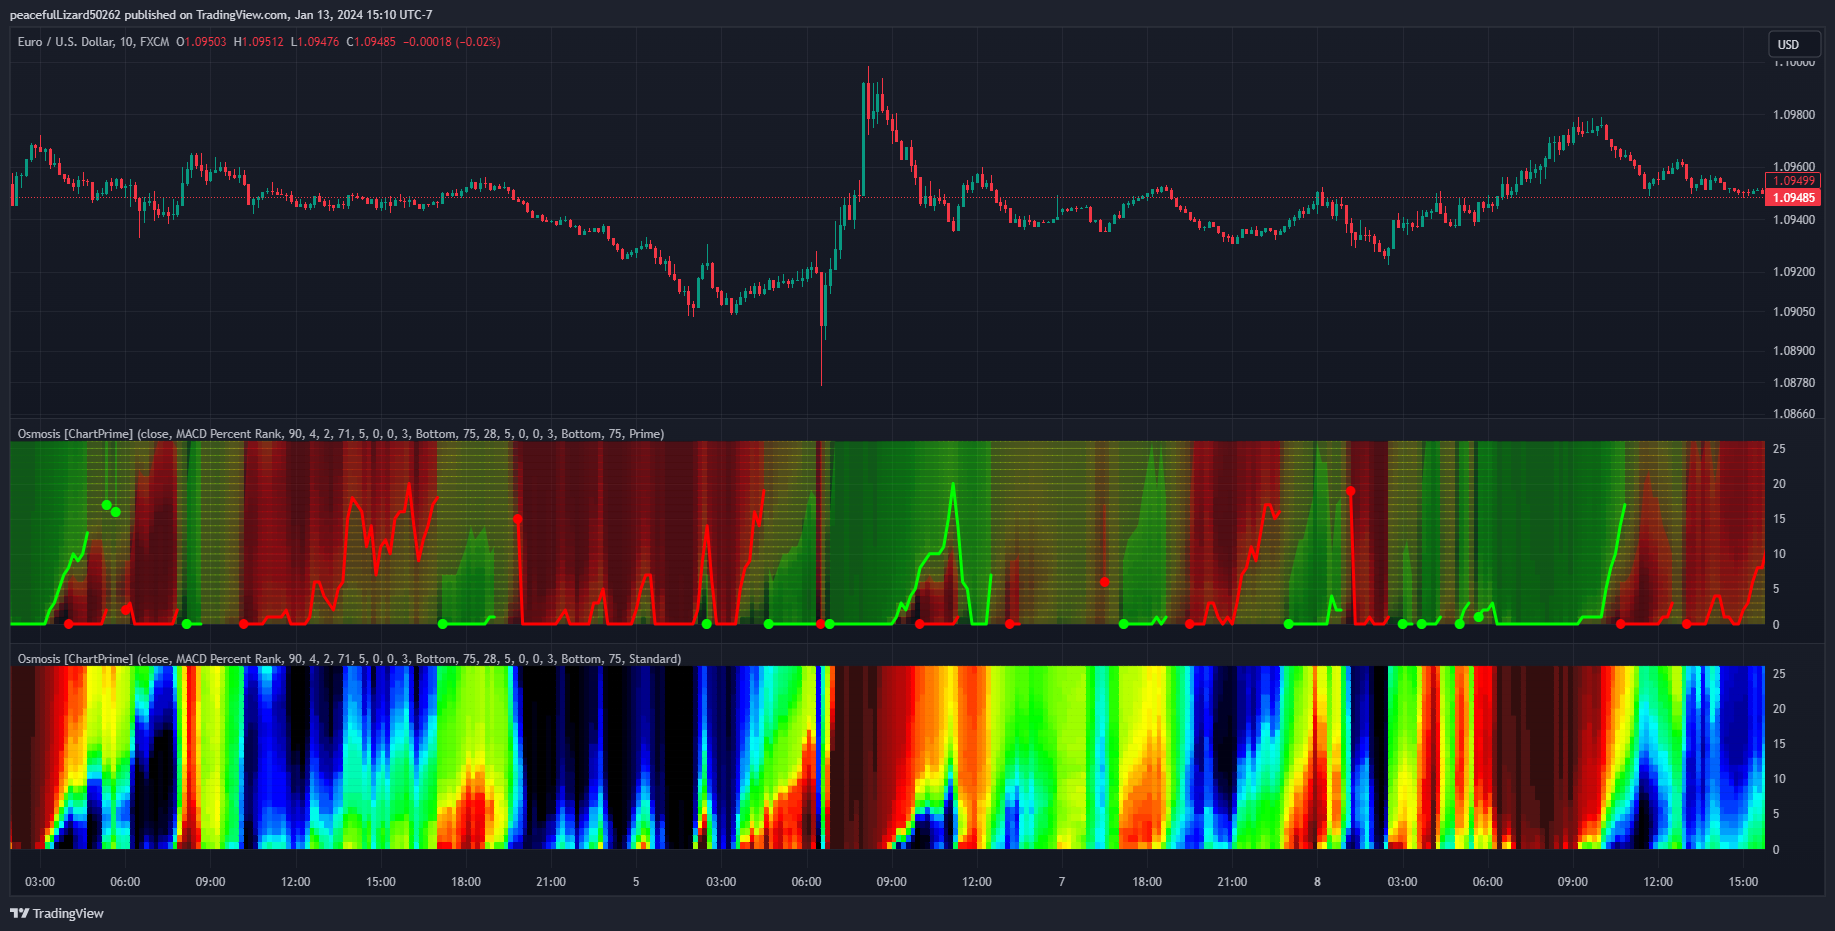
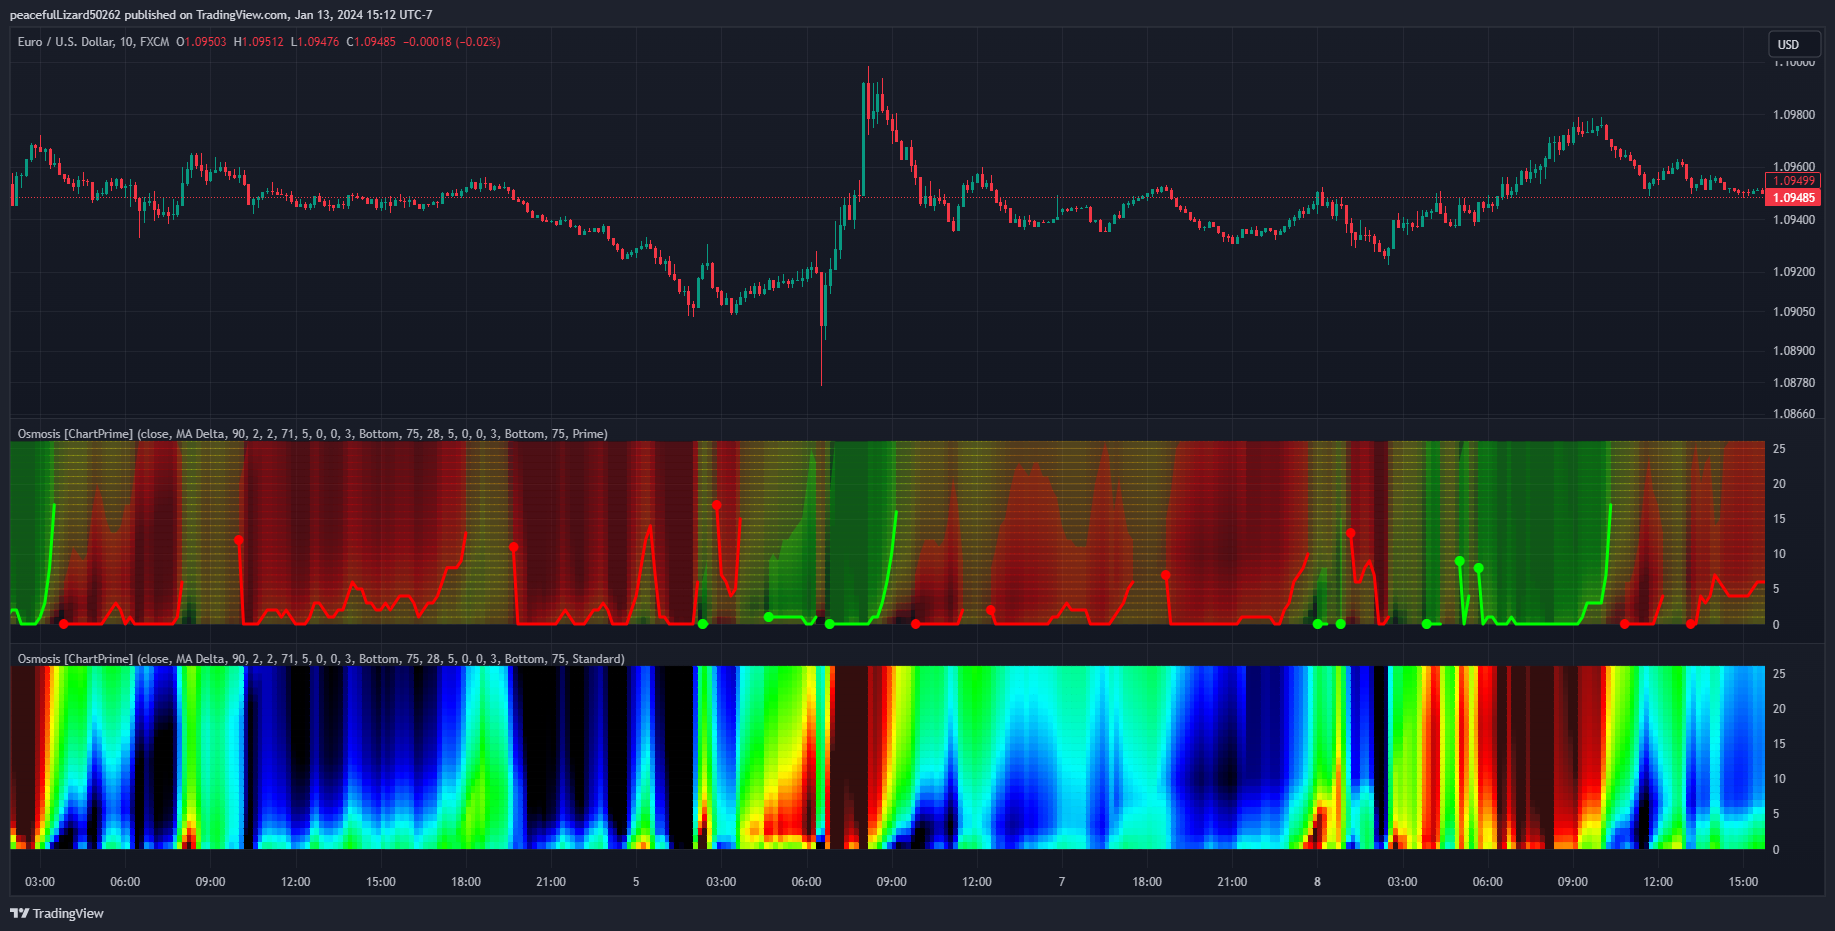
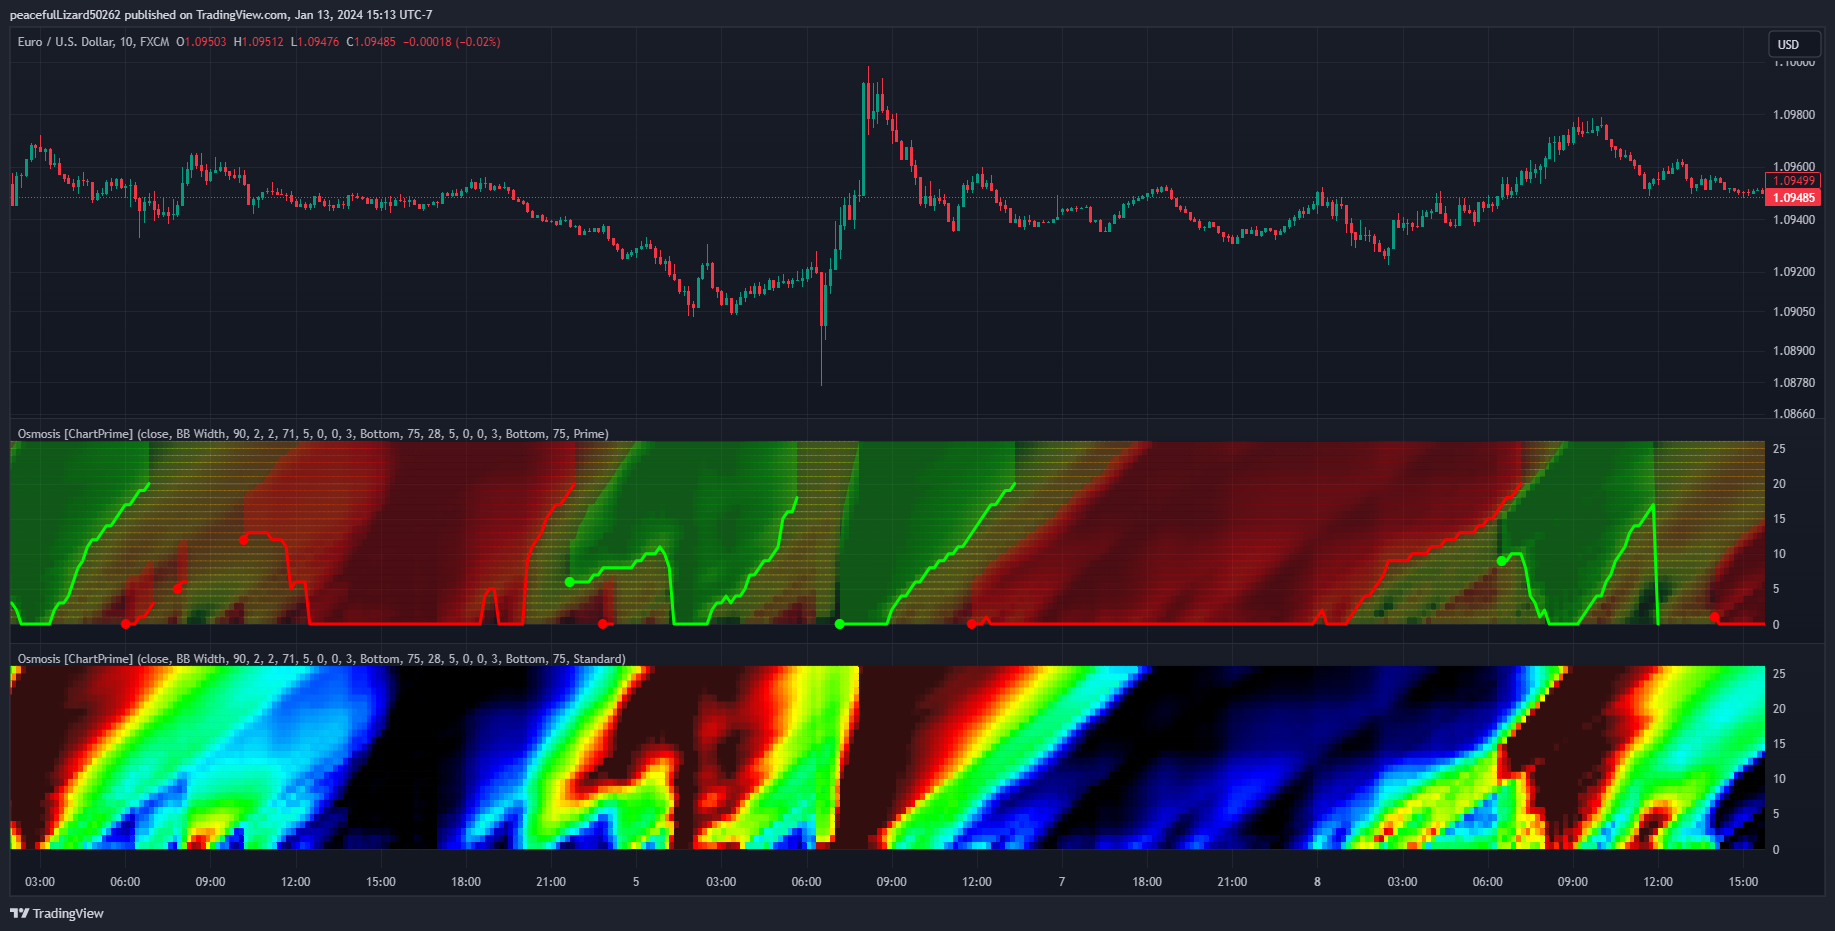
All of the indicators are normalized using min/max scaling driven by the highest highs and lows. The period of this scaling is adjustable by changing the "Lookback" parameter under settings. Delta length changes the lookback for "MA Delta" and "Volume Delta". A longer period corresponds to a smoother output. Fast Mode scales back the range of the indicator, literally halving the increment.
//@version=5
indicator("Osmosis [ChartPrime]", precision=0, max_labels_count=500)

heatmapColor(series float source, simple string colorScheme, simple bool invert, simple array customColors) =>
    float value = invert ? source : 100.0 - source
    if colorScheme == "Prime"
        switch
            value <   0.0 => #000000
            value <  14.3 => color.from_gradient(value,  0.0,  14.3, #6600FF, #0000FF)
            value <  28.6 => color.from_gradient(value, 14.3,  28.6, #0000FF, #00FFFF)
            value <  42.9 => color.from_gradient(value, 28.6,  42.9, #00FFFF, #00FF00)
            value <  57.1 => color.from_gradient(value, 42.9,  57.1, #00FF00, #FFFF00)
            value <  71.4 => color.from_gradient(value, 57.1,  71.4, #FFFF00, #FF8000)
            value <  85.7 => color.from_gradient(value, 71.4,  85.7, #FF8000, #FF0000)
            value <=100.0 => color.from_gradient(value, 85.7, 100.0, #FF0000, #FF00FF)
            =>               #FFFFFF
    else if colorScheme == "Standard"
        switch
            value <   0.0  => #000000
            value <   20.0 => color.from_gradient(value,  0.0,  20.0, #008000, #00FF00)
            value <   40.0 => color.from_gradient(value, 20.0,  40.0, #00FF00, #FFFF00)
            value <   60.0 => color.from_gradient(value, 40.0,  60.0, #FFFF00, #FF8000)
            value <   80.0 => color.from_gradient(value, 60.0,  80.0, #FF8000, #FF0000)
            value <= 100.0 => color.from_gradient(value, 80.0, 100.0, #FF0000, #800000)
            =>                #FFFFFF
    else // colorScheme == "User Defined"
        switch
            value <    0.0 => #000000
            value <   25.0 => color.from_gradient(value,  0.0,  25.0, customColors.get(0), customColors.get(1))
            value <   50.0 => color.from_gradient(value, 25.0,  50.0, customColors.get(1), customColors.get(2))
            value <   75.0 => color.from_gradient(value, 50.0,  75.0, customColors.get(2), customColors.get(3))
            value <= 100.0 => color.from_gradient(value, 75.0, 100.0, customColors.get(3), customColors.get(4))
            =>                #FFFFFF

max(series float source, simple int outlier_level, simple int dev_lookback) =>
    var float maxima = na
    array src = array.new()
    float      stdev = math.abs((source - ta.ema(source, dev_lookback)) / ta.stdev(source, dev_lookback))
    src.push(stdev < outlier_level ? source : -1.7976931348623157e+308)
    maxima := math.max(nz(maxima[1]), src.get(0))

min(series float source, simple int outlier_level, simple int dev_lookback) =>
    var float minima = na
    array src = array.new()
    float      stdev = math.abs((source - ta.ema(source, dev_lookback)) / ta.stdev(source, dev_lookback))
    src.push(stdev < outlier_level ? source : 1.7976931348623157e+308)
    minima := math.min(nz(minima[1]), src.get(0))

min_max(series float source, simple int outlier_level, simple int dev_lookback) =>
    float out = (source - min(source, outlier_level, dev_lookback)) / (max(source, outlier_level, dev_lookback) - min(source, outlier_level, dev_lookback)) * 100.0
    math.max(0.0, math.min(100.0, out))

diff(series float source, simple int length) =>
    switch length
        1  =>  source -     source[1]
        2  => (source -     source[2]) / 2
        3  => (source +     source[1] -      source[2] - source[3]) / 4
        4  => (source + 2 * source[1] -  2 * source[3] - source[4]) / 8
        5  => (source + 3 * source[1] +  2 * source[2] -  2 * source[3] -  3 * source[4] -      source[5]) / 16
        6  => (source + 4 * source[1] +  5 * source[2] -  5 * source[4] -  4 * source[5] -      source[6]) / 32
        7  => (source + 5 * source[1] +  9 * source[2] +  5 * source[3] -  5 * source[4] -  9 * source[5] -  5 * source[6] -      source[7]) / 64
        8  => (source + 6 * source[1] + 14 * source[2] + 14 * source[3] - 14 * source[5] - 14 * source[6] -  6 * source[7] -      source[8]) / 128
        9  => (source + 7 * source[1] + 20 * source[2] + 28 * source[3] + 14 * source[4] - 14 * source[5] - 28 * source[6] - 20 * source[7] - 7 * source[8] - source[ 9]) / 256
        =>    (source + 8 * source[1] + 27 * source[2] + 48 * source[3] + 42 * source[4] - 42 * source[6] - 48 * source[7] - 27 * source[8] - 8 * source[9] - source[10]) / 512 // 10

average_true_range(series float source, simple int length) =>
    float true_range = high - low
    float     _range = math.abs(open - close)
    float    a_range = (true_range * 2.0 + _range) / 3.0
    ta.rma(a_range, length)

tr_score(series float source, simple int length) =>
    (source - ta.sma(source, length)) / average_true_range(source, length)

tr_algo(series float source, simple int length, smooth) =>
    min_max(ta.sma(tr_score(source, length), smooth), 1, length)

ema(series float source, simple float length) =>
    var float alpha = 2.0 / (length + 1)
    var float  beta = 1.0 - alpha
    float smoothed = na
    smoothed := alpha * source + beta * nz(smoothed[1], source)

preFilter(series float source, simple int period) =>
    var float halfPeriod = 0.5 * period
    var int  periodPlus1 =   1 + period
    if period > 1
        float E = 0.0
        float W = 0.0
        for int i=1 to period
            float w = if i < halfPeriod
                i + 1
            else
                periodPlus1 - i
            E += w * source[i - 1]
            W += w
        E / W
    else
        source

method find_streak(series array  self,
                   simple float    threshold,
                   simple bool   bullishMode,
                   simple int streakDuration,
                   simple bool        enable) =>
    var int sizeOf = self.size() - 1
    int streak_start_index     = na
    int max_streak_start_index = na
    int max_streak_end_index   = na
    int streak_maxima          = 0
    int streak_count           = 0
    if enable
        int i = 0
        while i < sizeOf
            if streak_maxima > sizeOf
                break
            float current = self.get(i)
            if(not bullishMode and current <= threshold)
               or (bullishMode and current >= threshold)
                streak_count := 1
                int j = i + 1
                while j < sizeOf and ((bullishMode and self.get(j) >= threshold)
                               or (not bullishMode and self.get(j) <= threshold))
                    streak_count += 1
                    j            += 1
                if streak_count > streak_maxima
                    streak_maxima          := streak_count
                    max_streak_start_index := i
                    max_streak_end_index   := j + 1
                i := j
            else
                i += 1
    if streak_maxima >= streakDuration
        [max_streak_end_index + 1, max_streak_start_index + 1]
    else
        [na, na]

normalize(series float source, simple int length) =>
    float lowestLow = ta.lowest(source, length)
    (source - lowestLow) / (ta.highest(source, length) - lowestLow) * 100.0

stdev(series float source, simple int length) =>
    math.sqrt(math.sum(math.pow(source - ta.ema(source, length), 2), length) * 0.5) * 0.5

fastMode(simple int length, simple bool fastMode) =>
    fastMode ? int(length / 2) : length

rsi(series float source, simple int length) =>
    float rsi = ta.rsi(source, length)
    float   f =  -math.pow(math.abs(math.abs(rsi - 50.0) - 50.0), 1.0 + math.pow(length, 0.707) - 1.0) /      // 0.618 14 ###############################
                                                         math.pow(50.0, math.pow(length, 0.707) - 1.0) + 50.0 // 0.618 14 ###############################
    if rsi > 50.0
        50.0 + f
    else
        50.0 - f

trend_angle(series float source, simple int length, simple int preFilterLength) =>
    float degrees = preFilter((math.todegrees(math.atan((source - source[length]) / ta.atr(length))) + 90.0) / 180.0 * 100.0, preFilterLength)


string   sources = "Alternative Input Sourcing"
float  altsource = input.source(close,     " Source:", group=sources, inline=sources)
float highsource = input.source( high,       " High:", group=sources, inline=sources)
float  lowsource = input.source(  low,        " Low:", group=sources, inline=sources)
int    preFilter = input.int   (    1, "PreSmoothing", group=sources, minval=1)

string  settings = "Algorithm Settings"
string algorithm = input.string("Normalized MACD", "Select an Algorithm", group=settings,
   options=["MACD Histogram", "Normalized MACD", "Slow MACD", "MACD Percent Rank", "MA Delta *",
  "BB Width", "BB Width Percentile", "RSI", "Stochastic", "True Range Algo", "Normalized Volume",
  "Volume Delta *", "True Range", "Rate of Change", "OBV", "MFI", "Trend Angle"])
int normLength = input.int (   90, "Normalization Lookback", group=settings, minval=1, tooltip="???????????????????????????????")
int  madLength = input.int (    4,         "Delta Length *", group=settings, minval=1, maxval=10, tooltip="???????????????????????????????")
bool  fastMode = input.bool(false,       "Enable Fast Mode", group=settings, tooltip="???????????????????????????????")

string  colors = "Heatmap Color Options"
bool    invert = input.bool  (   false,   "Invert Colors     ", group=colors, inline=colors)
string  scheme = input.string( "Standard",       "Color Schemes:", group=colors, inline=colors, options=["Standard","Prime","User Defined"])
color color000 = input.color(#0000FF, "User Defined Colors:", group=colors, inline=colors)
color color025 = input.color(#00FFFF,                     "", group=colors, inline=colors)
color color050 = input.color(#00Ff00,                     "", group=colors, inline=colors)
color color075 = input.color(#FFFF00,                     "", group=colors, inline=colors)
color color100 = input.color(#FF0000,                     "", group=colors, inline=colors)

string     regions = "Trend Streak Options"
string   emphasize = input.string(   "Both",         "Emphasize Trends", group=regions, options=["Both","Bullish","Bearish","Disabled"])
int upperThreshold = input.int   (       70,      "Thresholds - Upper:", group=regions, inline="thresh", minval=50, maxval=100, step=5)
int lowerThreshold = input.int   (       30,                   "Lower:", group=regions, inline="thresh", minval= 0, maxval= 50, step=5, tooltip="Upper threshold range: 50 to 100\nLower threshold range:  0 to 50")
int    maxDuration = input.int   (        5,   "   Duration - Bullish:", group=regions, inline="widths", minval= 0, maxval= 30, step=5)
int    minDuration = input.int   (        5,                 "Bearish:", group=regions, inline="widths", minval= 0, maxval= 30, step=5, tooltip="???????????????????????????????")
string   bullOnset = input.string( "Bottom", "Onset Markers - Bullish:", group=regions, inline="onsets", options=["Both","Top","Bottom","None"])
string   bearOnset = input.string(    "Top",                 "Bearish:", group=regions, inline="onsets", options=["Both","Top","Bottom","None"], tooltip="???????????????????????????????")
int  lineThickness = input.int   (        3,              "Line Widths", group=regions, minval=2, maxval=4)
color bearishColor = input.color (#008000,  "Trend Colors - Bearish:", group=regions, inline="colors")
color bullishColor = input.color (#800000,                 "Bullish:", group=regions, inline="colors")


indicator_picker(length) =>
    float alt_src   = preFilter( altsource, preFilter)
    float alt_high  = preFilter(highsource, preFilter)
    float alt_low   = preFilter( lowsource, preFilter)
    int fastLength2 = fastMode(2, fastMode)
    int fastLength3 = fastMode(3, fastMode)
    int fastLength4 = fastMode(4, fastMode)
    int fastLength5 = fastMode(5, fastMode)
    int fastLength6 = fastMode(6, fastMode)
    int tempLength5 = 5 + length * fastLength5
    switch algorithm
        "Normalized MACD"     =>  (length == 1 ? normalize(ta.ema(alt_src, fastLength3) - ta.ema(alt_src,              fastLength5), normLength) :
                                                 normalize(ta.ema(alt_src, fastLength5) - ta.ema(alt_src, 1 + length * fastLength6), normLength))
        "MACD Histogram"      => normalize(( ema(    alt_src, fastLength2 * length * 0.5 + 2.0)  -
                                             ema(    alt_src, fastLength4 * length * 0.5 + 2.0)) -
                                             ema(ema(alt_src, fastLength2 * length * 0.5 + 2.0)  -
                                             ema(    alt_src, fastLength4 * length * 0.5 + 2.0), 9), normLength)
        "MACD Percent Rank"   => ta.percentrank(ta.ema(alt_src, fastLength5) - ta.ema(alt_src, 1 + fastLength6 * length) , normLength)
        "Slow MACD"           => normalize(ta.ema(alt_src, fastMode(15, fastMode)) - ta.ema(alt_src, fastMode(20, fastMode) + length * fastLength5), normLength)
        "RSI"                 => rsi(preFilter(alt_src, preFilter), length)
        "True Range Algo"     => tr_algo(alt_src, fastLength2 * length, 3)
        "Normalized Volume"   => normalize(preFilter(     ta.wma(volume, 1 + (fastLength3 * (length - 1))),           preFilter), normLength)
        "Volume Delta *"      => normalize(preFilter(diff(ta.wma(volume, 1 + (fastLength3 * (length - 1))), madLength), preFilter), normLength)
        "MA Delta *"          => normalize(diff(ta.ema(alt_src, fastLength6 * length), madLength), normLength)
        "True Range"          => normalize(ta.rma(high - low,   fastLength2 * length),           normLength)
        "Rate of Change"      => normalize(ta.roc(alt_src,      fastLength3 * length),           normLength)
        "OBV"                 => normalize(preFilter(ta.obv - ta.wma(ta.obv, 2 + fastLength2 * length), preFilter), normLength)
        "MFI"                 => normalize(ta.mfi(preFilter(hlc3, preFilter),    fastLength3 + length), normLength)
        "BB Width"            => normalize((( ta.sma(alt_src, tempLength5) + ta.stdev(alt_src, tempLength5))  -
                                             (ta.sma(alt_src, tempLength5) - ta.stdev(alt_src, tempLength5))) /
                                              ta.sma(alt_src, tempLength5), normLength)
        "BB Width Percentile" => ta.percentrank(((ta.sma(alt_src, tempLength5) + ta.stdev(alt_src, tempLength5))  -
                                                 (ta.sma(alt_src, tempLength5) - ta.stdev(alt_src, tempLength5))) /
                                                  ta.sma(alt_src, tempLength5), normLength)
        "Stochastic"          => ta.sma(ta.stoch(alt_src, alt_high, alt_low, fastLength2 * length), 3)
        =>                       trend_angle(close, fastLength2 * length, preFilter) // "Trend Angle"


float algo02 = indicator_picker( 2)
float algo03 = indicator_picker( 3)
float algo04 = indicator_picker( 4)
float algo05 = indicator_picker( 5)
float algo06 = indicator_picker( 6)
float algo07 = indicator_picker( 7)
float algo08 = indicator_picker( 8)
float algo09 = indicator_picker( 9)

float algo10 = indicator_picker(10)
float algo11 = indicator_picker(11)
float algo12 = indicator_picker(12)
float algo13 = indicator_picker(13)
float algo14 = indicator_picker(14)
float algo15 = indicator_picker(15)
float algo16 = indicator_picker(16)
float algo17 = indicator_picker(17)
float algo18 = indicator_picker(18)
float algo19 = indicator_picker(19)

float algo20 = indicator_picker(20)
float algo21 = indicator_picker(21)
float algo22 = indicator_picker(22)
float algo23 = indicator_picker(23)
float algo24 = indicator_picker(24)
float algo25 = indicator_picker(25)
float algo26 = indicator_picker(26)
float algo27 = indicator_picker(27)
float algo28 = indicator_picker(28)
float algo29 = indicator_picker(29)

var array customColors = array.from(color000, color025, color050, color075, color100)

plot( 2,  "2", heatmapColor(algo02, scheme, invert, customColors), style=plot.style_area, histbase= 1, editable=false, display=display.pane)
plot( 3,  "3", heatmapColor(algo03, scheme, invert, customColors), style=plot.style_area, histbase= 2, editable=false, display=display.pane)
plot( 4,  "4", heatmapColor(algo04, scheme, invert, customColors), style=plot.style_area, histbase= 3, editable=false, display=display.pane)
plot( 5,  "5", heatmapColor(algo05, scheme, invert, customColors), style=plot.style_area, histbase= 4, editable=false, display=display.pane)
plot( 6,  "6", heatmapColor(algo06, scheme, invert, customColors), style=plot.style_area, histbase= 5, editable=false, display=display.pane)
plot( 7,  "7", heatmapColor(algo07, scheme, invert, customColors), style=plot.style_area, histbase= 6, editable=false, display=display.pane)
plot( 8,  "8", heatmapColor(algo08, scheme, invert, customColors), style=plot.style_area, histbase= 7, editable=false, display=display.pane)
plot( 9,  "9", heatmapColor(algo09, scheme, invert, customColors), style=plot.style_area, histbase= 8, editable=false, display=display.pane)
plot(10, "10", heatmapColor(algo10, scheme, invert, customColors), style=plot.style_area, histbase= 9, editable=false, display=display.pane)

plot(11, "11", heatmapColor(algo11, scheme, invert, customColors), style=plot.style_area, histbase=10, editable=false, display=display.pane)
plot(12, "12", heatmapColor(algo12, scheme, invert, customColors), style=plot.style_area, histbase=11, editable=false, display=display.pane)
plot(13, "13", heatmapColor(algo13, scheme, invert, customColors), style=plot.style_area, histbase=12, editable=false, display=display.pane)
plot(14, "14", heatmapColor(algo14, scheme, invert, customColors), style=plot.style_area, histbase=13, editable=false, display=display.pane)
plot(15, "15", heatmapColor(algo15, scheme, invert, customColors), style=plot.style_area, histbase=14, editable=false, display=display.pane)
plot(16, "16", heatmapColor(algo16, scheme, invert, customColors), style=plot.style_area, histbase=15, editable=false, display=display.pane)
plot(17, "17", heatmapColor(algo17, scheme, invert, customColors), style=plot.style_area, histbase=16, editable=false, display=display.pane)
plot(18, "18", heatmapColor(algo18, scheme, invert, customColors), style=plot.style_area, histbase=17, editable=false, display=display.pane)
plot(19, "19", heatmapColor(algo19, scheme, invert, customColors), style=plot.style_area, histbase=18, editable=false, display=display.pane)
plot(20, "20", heatmapColor(algo20, scheme, invert, customColors), style=plot.style_area, histbase=19, editable=false, display=display.pane)

plot(21, "21", heatmapColor(algo21, scheme, invert, customColors), style=plot.style_area, histbase=20, editable=false, display=display.pane)
plot(22, "22", heatmapColor(algo22, scheme, invert, customColors), style=plot.style_area, histbase=21, editable=false, display=display.pane)
plot(23, "23", heatmapColor(algo23, scheme, invert, customColors), style=plot.style_area, histbase=22, editable=false, display=display.pane)
plot(24, "24", heatmapColor(algo24, scheme, invert, customColors), style=plot.style_area, histbase=23, editable=false, display=display.pane)
plot(25, "25", heatmapColor(algo25, scheme, invert, customColors), style=plot.style_area, histbase=24, editable=false, display=display.pane)
plot(26, "26", heatmapColor(algo26, scheme, invert, customColors), style=plot.style_area, histbase=25, editable=false, display=display.pane)
plot(27, "27", heatmapColor(algo27, scheme, invert, customColors), style=plot.style_area, histbase=26, editable=false, display=display.pane)
plot(28, "28", heatmapColor(algo28, scheme, invert, customColors), style=plot.style_area, histbase=27, editable=false, display=display.pane)
plot(29, "29", heatmapColor(algo29, scheme, invert, customColors), style=plot.style_area, histbase=28, editable=false, display=display.pane)

array algoArray = array.from( algo02, algo03, algo04, algo05, algo06, algo07, algo08, algo09, algo10, algo11, algo12, algo13, algo14, algo15,
                                     algo16, algo17, algo18, algo19, algo20, algo21, algo22, algo23, algo24, algo25, algo26, algo27, algo28, algo29)
[upperBullishStreak, lowerBullishStreak] = algoArray.find_streak(upperThreshold,  true, maxDuration, emphasize=="Both" or emphasize=="Bullish")
[upperBearishStreak, lowerBearishStreak] = algoArray.find_streak(lowerThreshold, false, minDuration, emphasize=="Both" or emphasize=="Bearish")

plot(upperBullishStreak, "Bullish Region Top",    bearishColor, lineThickness-1, plot.style_circles, display=display.pane)
plot(lowerBullishStreak, "Bullish Region Bottom", bearishColor, lineThickness,   plot.style_linebr,  display=display.pane)
plot(upperBearishStreak, "Bearish Region Top",    bullishColor, lineThickness,   plot.style_linebr,  display=display.pane)
plot(lowerBearishStreak, "Bearish Region Bottom", bullishColor, lineThickness-1, plot.style_circles, display=display.pane)

if not na(lowerBullishStreak) and na(lowerBullishStreak[1])
    if bullOnset=="Top"    or bullOnset=="Both"
        label.new(bar_index, upperBullishStreak, "⬤", style=label.style_text_outline, textcolor=bearishColor, color=#00000000, size=size.normal)
    if bullOnset=="Bottom" or bullOnset=="Both"
        label.new(bar_index, lowerBullishStreak, "⬤", style=label.style_text_outline, textcolor=bearishColor, color=#00000000, size=size.normal)
if not na(lowerBearishStreak) and na(lowerBearishStreak[1])
    if bearOnset=="Top"    or bearOnset=="Both"
        label.new(bar_index, upperBearishStreak, "⬤", style=label.style_text_outline, textcolor=bullishColor, color=#00000000, size=size.normal)
    if bearOnset=="Bottom" or bearOnset=="Both"
        label.new(bar_index, lowerBearishStreak, "⬤", style=label.style_text_outline, textcolor=bullishColor, color=#00000000, size=size.normal)